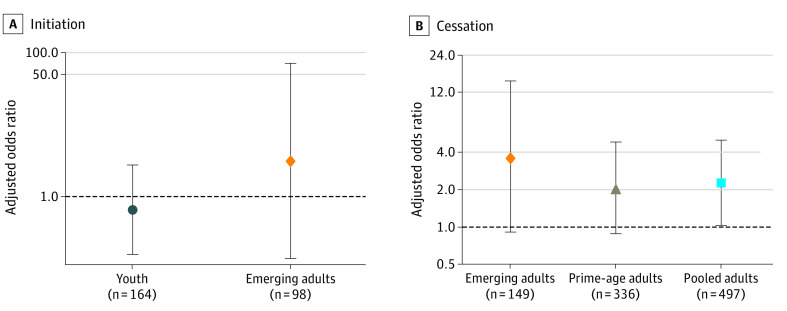
Figure 2. Adjusted Odds Rations for the Relative Association of Flavored vs Unflavored Vaping Uptake With Subsequent Smoking.
Adjusted odds ratios and 95% CIs are presented from sample-weighted logistic regressions using data from waves 1 to 3 of the Population Assessment of Tobacco and Health Study. Use of flavored vs unflavored e-cigarettes was attained from respondents categorized as vaping in wave 2. All regressions controlled for fixed effects for male sex, race (black and other, with white as the reference group), Hispanic, age group, household income categories (wave 2 parental reports for youths, wave 1 self-reports for adults), and (for initiation analyses only) an indicator for having ever tried conventional cigarettes at wave 1, as well as missing-observation indicators for each of these variables. Additionally, youth regressions controlled for baseline parental education (high school graduate or equivalent, some college, and ≥college graduate, with <high school graduate as the reference group), whereas adult regressions controlled for a binary indicator of completing any college to reflect adults’ own education at baseline. The emerging adult initiation analysis omitted data for 2 respondents with missing e-cigarette flavors, 1 respondent with missing Hispanic ethnicity, and 1 respondent with missing baseline education because of perfect predictivity. The emerging adult cessation analysis omitted data for 7 respondents with missing flavor responses, 1 with missing Hispanic ethnicity, and 1 with missing baseline education. The prime-age adult analysis omitted 3 responses with missing race. See eTables 5, 7, and 9 in the Supplement for full regression output.

