
Figure 1: Detailed molecular characterization of CREBBPR1446C and CREBBPKO mutations using isogenic CRISPR/Cas9-modified lymphoma cells.
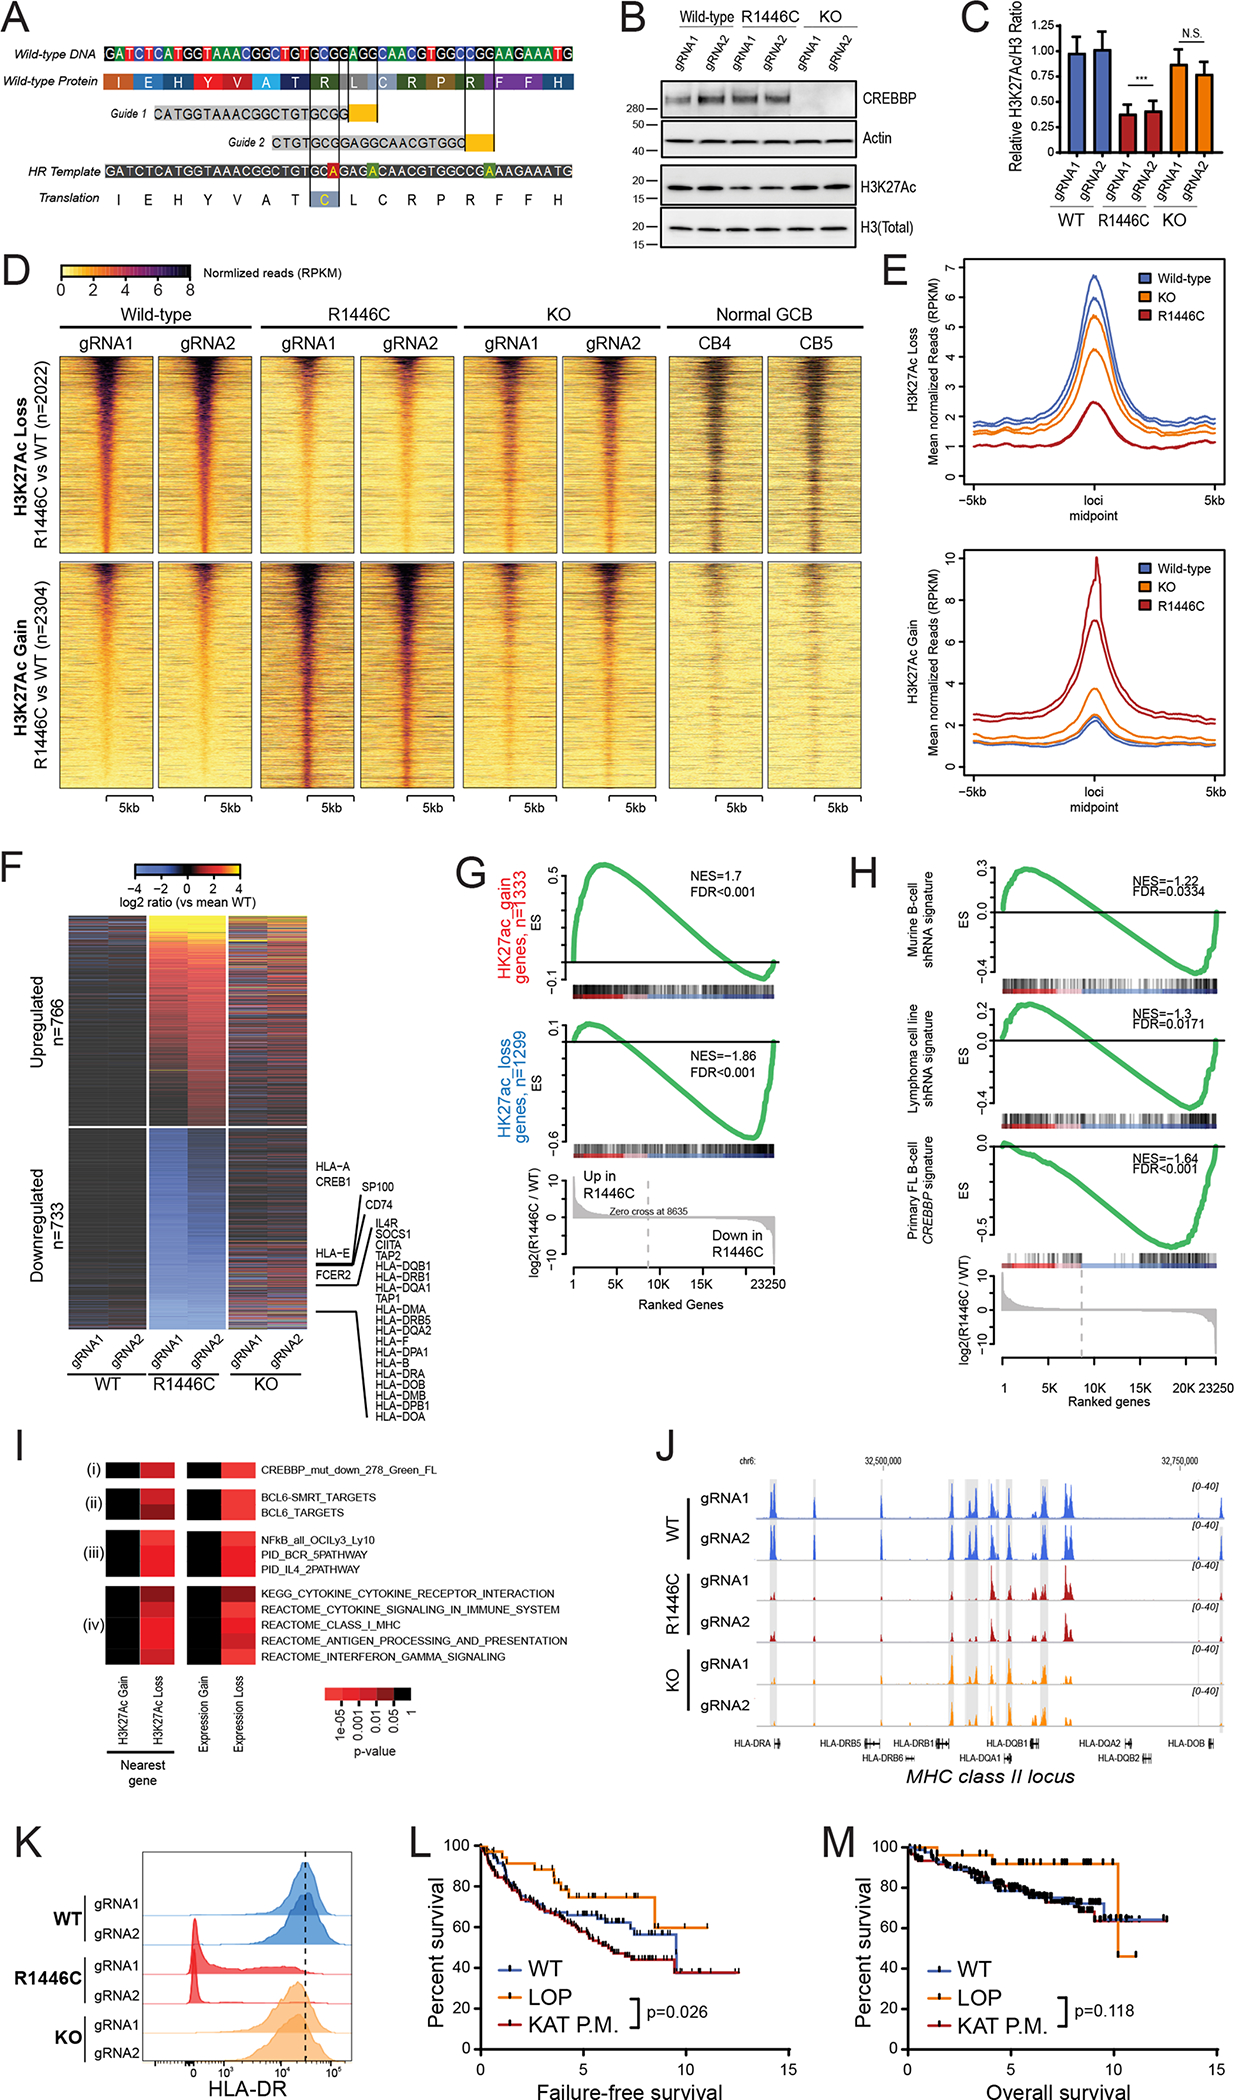
A) A diagram shows the CRISPR/Cas9 gene editing strategy. Two guides were designed that were proximal to the R1446 codon, with PAM sites highlighted in yellow. A single stranded Homologous Recombination (HR) template was utilized that encoded silent single nucleotide changes that interfered with the PAM sites but did not change the protein coding sequence, and an additional single nucleotide change that encoded the R1446C mutation. B) A representative western blot shows that the CREBBPR1446C protein is expressed at similar levels to that of wild-type CREBBP, whereas CREBBPKO results in a complete loss of protein expression as expected. The level of H3K27Ac shows a more visible reduction in CREBBPR1446C cells compared to isogenic CREBBPWT cells than that observed in CREBBPKO cells. C) Quantification of triplicate western blot experiments shows that there is a significant reduction of H3K27Ac in CREBBPR1446C cells compared to CREBBPWT cells (T-test p-value <0.001). A reduction is also observed in CREBBPKO cells, but this was not statistically significant (T-test p-value = 0.106). D) Heat maps show the regions of significant H3K27Ac loss (n=2022, above) and gain (n=2304, below) in CREBBPR1446C cells compared to isogenic WT controls. The regions with reduced H3K27Ac in CREBBPR1446C cells can be seen to normally bear this mark in GCB cells. E) Density plots show that the degree of H3K27Ac loss (above) is most notable in CREBBPR1446C cells compared to isogenic WT cells, while CREBBPKO cells show an intermediate level of loss. Regions with H3K27Ac gain (below) in CREBBPR1446C cells showed fewer changes in CREBBPKO cells. F) A heat map of RNA-seq data shows that there are a similar number of genes with increased (n=766) and decreased (n=733) expression in CREBBPR1446C cells compared to isogenic WT controls. The CREBBPKO cells again show an intermediate level of change, with expression between that of CREBBPWT and CREBBPR1446C cells. G) Gene set enrichment analysis of the genes most closely associated with regions of H3K27Ac gain (above) or loss (below) shows that these epigenetic changes are significantly associated with coordinately increased or decreased expression in CREBBPR144C cells compared to isogenic WT controls, respectively. H) Gene set enrichment analysis shows that genes which were previously found to be down-regulated following shRNA-mediated knock-down of CREBBP in murine B-cells (top) or human lymphoma cell lines (middle) are also reduced in CREBBPR1446C mutant cells compared to CREBBPWT cells. However, the most significant enrichment was observed for the signature of genes that we found to be significantly reduced in primary human FL with CREBBP mutation compared to CREBBP wild-type tumors. I) Hypergeometric enrichment analysis identified sets of genes that were significantly over-represented in those with altered H3K27Ac or expression in CREBBPR1446C cells. This included (i) gene sets associated with CREBBP mutation in primary tumors, (ii) BCL6 target genes, (iii) BCR and IL4 signaling pathways, and (iv) gene sets involving immune responses, antigen presentation and interferon signaling were significantly enriched. J) ChIP-seq tracks of the MHC class II locus on chromosome 6 are shown for isogenic CREBBPWT (blue), CREBBPR1446C (red) and CREBBPKO (orange) cells with regions of significant H3K27Ac loss shaded in grey. A significant reduction can be observed between CREBBPWT and CREBBPR1446C cells, with CREBBPKO cells harboring an intermediate level H3K27Ac over these loci. K) Flow cytometry for HLA-DR shows that reduced H3K27Ac over the MHC class II region is associated with changes of cell surface protein expression. A ~2-fold reduction is observed in CREBBPKO cell compared to CREBBPWT, but a dramatic ~39-fold reduction is observed in CREBBPR1446C cells. L) Kaplan-Meier plots show the failure free survival in 231 previously untreated FL patients according to their CREBBP mutation status. Nonsense/frameshift mutations that create a loss-of-protein (LOP) are associated with a significantly better failure-free survival compared to KAT domain point mutations (KAT P.M.; log-rank P=0.026). M) Kaplan-Meier plots show the overall survival in 231 previously untreated FL patients according to their CREBBP mutation status. Patients with LOP mutations have a trend towards better overall survival, but this is not statistically significant (log-rank P=0.118).