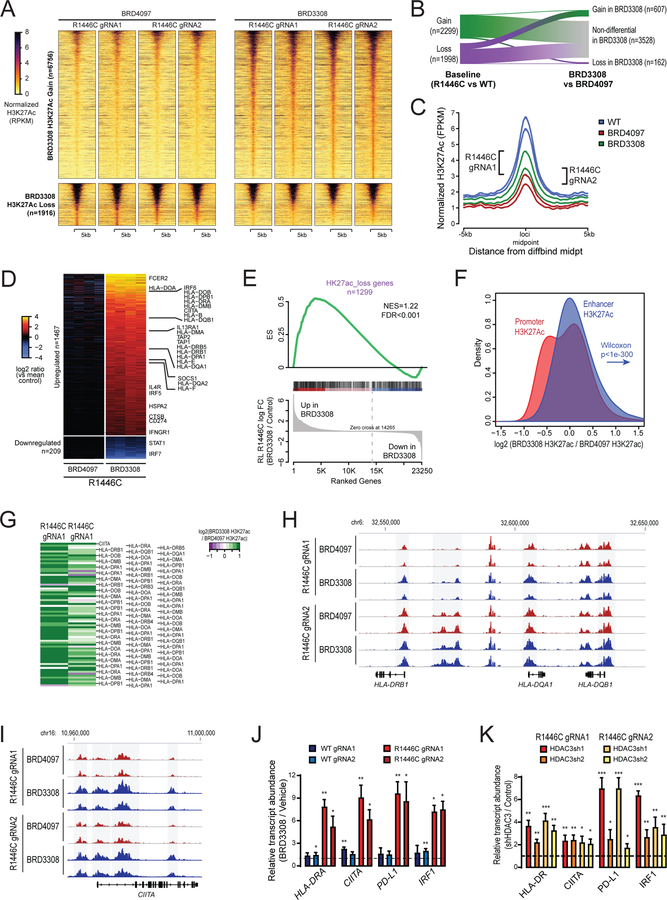
Figure 4: HDAC3 inhibition counteracts the molecular phenotype of CREBBP mutation.
A) A heat map shows the regions with significantly increased (above, n=6756) or decreased (below, n=1916) H3K27Ac in CREBBPR1446C cells treated with BRD3308 compared to those treated with the control compound, BRD4097. Experimental duplicates are shown for each clone. B) A river plot show that a large fraction of the regions with significantly reduced H3K27Ac in CREBBPR1446C cells compared to CREBBPWT cells had significantly increased H3K27Ac following BRD3308 treatment. C) A density plot shows the regions with reduced H3K27Ac in CREBBPR1446C compared to CREBBPWT cells. The level of H3K27Ac over these regions is increased in CREBBPR1446C cells treated with BRD3308 compared to control (BRD4097), but does not reach the level observed in CREBBPWT cells. D) A heat map shows the genes with increased (above, n=1467) or decreased expression (below, n=209) following BRD3308 treatment. Duplicate experiments are shown for each of the two CREBBPR1446C clones. Interferon-responsive genes, including those with a role in antigen processing and presentation, can be observed to increase in expression following BRD3308 treatment. E) Gene set enrichment analysis shows that the set of genes with reduced H3K27Ac in association with CREBBP mutation has coordinately increased expression following BRD3308 treatment. F) A density plot illustrates the relative change in promoter (red) and enhancer (blue) H3K27Ac following treatment with BRD3308, with the enhancer distribution being significantly more right-shifted (increased) compared to promoter regions. G) A heat map shows the change in H3K27Ac at the promoter regions of MHC class II genes following BRD3308 treatment of CREBBPR1446C cells, showing a coordinate increase. H-I) Regions with significantly increased H3K27Ac (shaded in grey) included those within the MHC class II and CIITA gene loci. J) The increased expression of candidate genes within the interferon signaling and antigen presentation pathways was confirmed by qPCR. Increased expression was observed in both CREBBPWT and CREBBPR1446C cells following BRD3308 treatment, but the level of induction was much higher in CREBBPR1446C cells. Data are shown relative to vehicle treated cells (T-test *P<0.05, **P<0.01, ***P<0.001). K) The on-target role of HDAC3 in the induction of candidate genes was confirmed by shRNA-mediated knock-down of HDAC3 and qPCR analysis of gene expression. Knock-down of HDAC3 was able to induce the expression of all genes, which is shown relative the control shRNA (T-test *P<0.05, **P<0.01, ***P<0.001).

