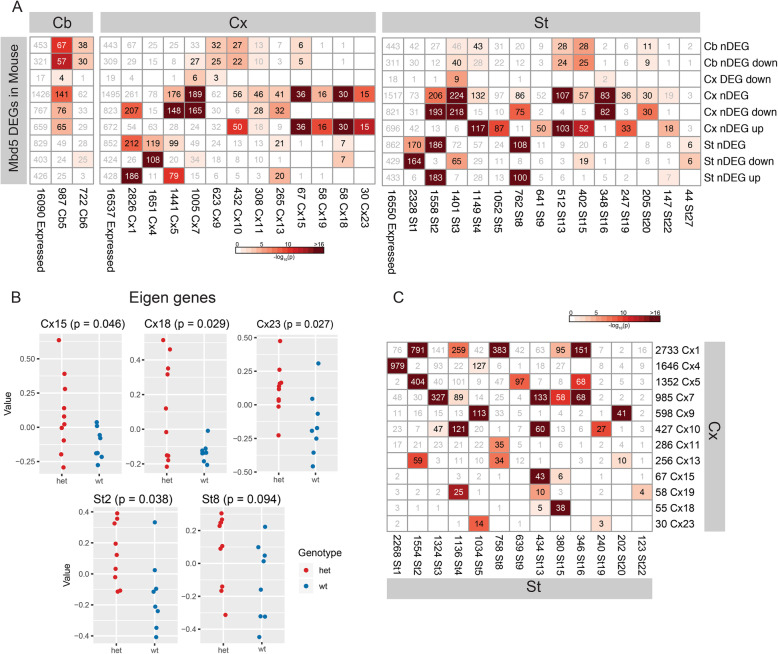
Fig. 3.
Co-expression network analysis in mouse brain regions. a Enrichments of co-expression modules in each brain region for differentially expressed genes. Only modules with significant enrichments are shown. The color of the heatmap shows the −log10(p) of Fisher’s enrichment test, and the number shows number of genes that overlap. The number next to the module name in the columns shows total number of expressed genes in that module. b Eigenvalues of modules with significant differences in values between two genotypes. The value in each plot title shows corresponding p value of t test between eigenvalues of two genotypes. c Enrichments of genes from striatum and cortex co-expression modules. Only modules with enrichment for nDEGs and a corresponding overlapping module from the other brain region are shown. The color of the heatmap shows the −log10(p) of Fisher’s enrichment test, and the number shows number of genes that overlap. The number next to the module name in the columns shows total number of expressed genes in that module

