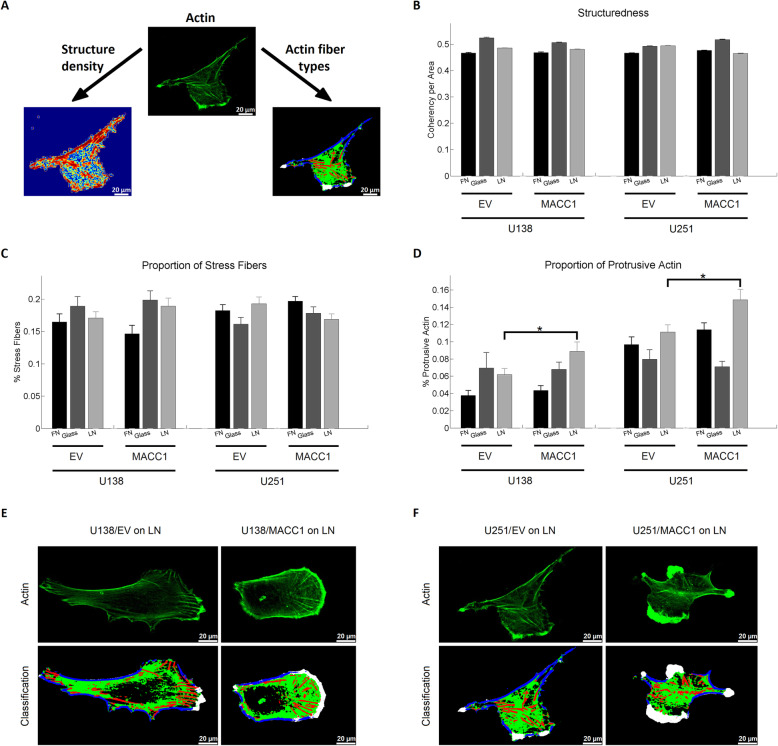
Fig. 5.
MACC1 increases the amount of protrusive actin. a Illustration of the two different approaches of the actin structure analysis, including the calculation of the structure density (bottom left) and classification of different actin structures (bottom right). Stress fibers are depicted in red, cortical fibers in blue, protrusive actin in white and punctuate actin in green. b Results of the structure density analysis. MACC1 overexpression did not have a significant effect on the structuredness of the actin cytoskeleton of U138 and U251 cells on neither substrate. c, d Results of actin fiber type analysis. MACC1 increased the amount of protrusive actin for U138 and U251 cells on laminin. e and f Representative images of U138 and U251 cells on laminin, illustrating the increase of protrusive actin for MACC1-overexpressing cells. The following numbers of images of three independent experiments were analyzed: nU138/EV Glass = 17, nU138/EV FN = 34, nU138/EV LN = 52, nU138/MACC1 Glass = 30, nU138/MACC1 FN = 44, nU138/MACC1 LN = 38, nU251/EV Glass = 35, nU251/EV FN = 67, nU251/EV LN = 70, nU251/MACC1 Glass = 36, nU251/MACC1 FN = 77 and nU251/MACC1 LN = 55. Stars depict p < 0.05. Error bars show the standard error of the mean. Scale bars depict 20 μm

