Fig. 3.
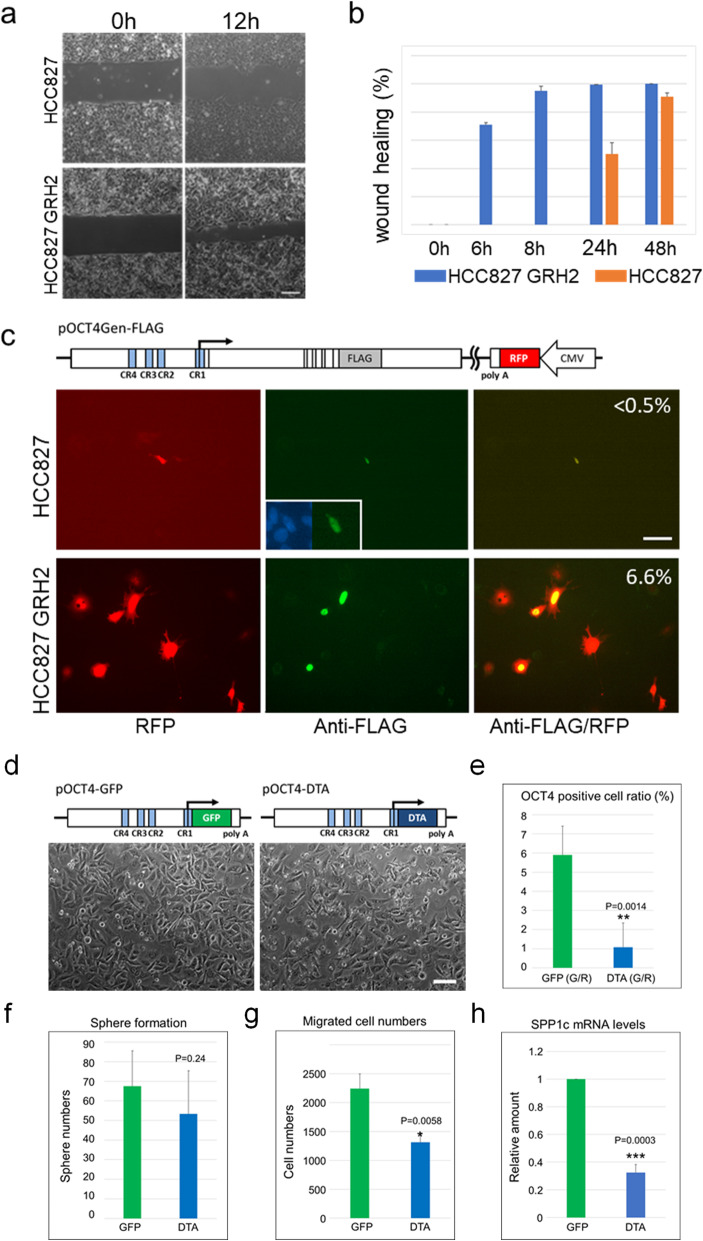
Characterisation of the OCT4-positive cell population in HCC827 and HCC827 GRH2 cells. a Representative bright-field images of wound-healing experiments acquired at 0- and 12-h post-wounding. Scale bar: 100 μm. b Migration rate was expressed as the percentage of wound-closure area. c Detection of possible OCT4 translation in HCC827 and HCC827 GRH2 cells using the FLAG-tagged genomic transgene (pOCT4Gen-FLAG) according to immunocytochemistry. RED: transfected RFP-positive cells; GREEN: FLAG-positive cells. The ratio of FLAG−/RFP-positive cells for each is indicated. Scale bar: 100 μm. d–h Effects of ablating OCT4-positive cells from HCC827 GRH2 cells. d Phase-contrast image of pOCT4-EGFP- or pOCT4-DTA-transfected HCC827 GRH2 cells at 24-h post-transfection. These cells were used for the assays described in e–h. e OCT4-positive cell rate among pOCT4-DTA-transfected HCC827 GRH2 cells. f Sphere-formation activities, g cell migration according to Transwell migration assays, and hSPP1C mRNA levels by qPCR. Data represent the mean ± standard deviation from three independent experiments. *P < 0.05, **P < 0.005, ***P < 0.0005, compared with the control. Scale bar: 100 μm

