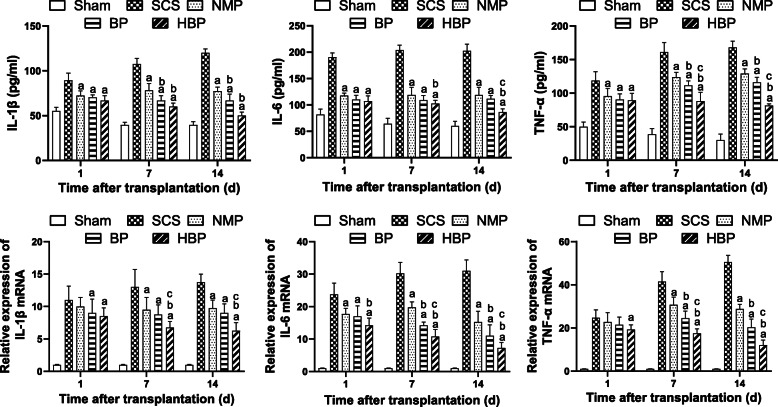
Fig. 7.
Levels of IL-1β, IL-6, and TNF-α in the serum and liver tissue. ELISA was used to determine the serum levels of IL-β, IL-6, and TNF-α, and qRT-PCR was used to determine the relative mRNA levels of IL-β, IL-6, and TNF-α in the liver tissue (aP < 0.05 vs. SCS group; bP < 0.05 vs. NMP group; cP < 0.05 vs. HBP group). On POD 1, the serum levels of IL-1β, IL-6, and TNF-α in the SCS group were significantly higher than those in other groups (P < 0.05), and no significant difference in levels between the NMP, BP, and HBP groups was observed. On POD 7, proinflammatory cytokine levels in the BP and HBP groups were lower than those in the SCS and NMP groups, and no significant difference in their levels between the BP and HBP groups was observed. On POD 14, their level in the HBP group decreased to near normal level and was lower than that in the BP group (P < 0.05). The mRNA expression pattern was similar to that of serum. The SCS group showed higher mRNA levels of IL-β, IL-6, and TNF-α than other groups on POD 1, and no difference in IL-β and TNF-α levels was observed between the NMP, BP, and HBP groups. However, on POD 7 and 14, the mRNA levels of IL-β, IL-6, and TNF-α in the BP and HBP groups were significantly lower than those in the SCS and NMP groups (P < 0.05), and on POD 14, their levels in the HBP group were significantly lower than those in the BP group

