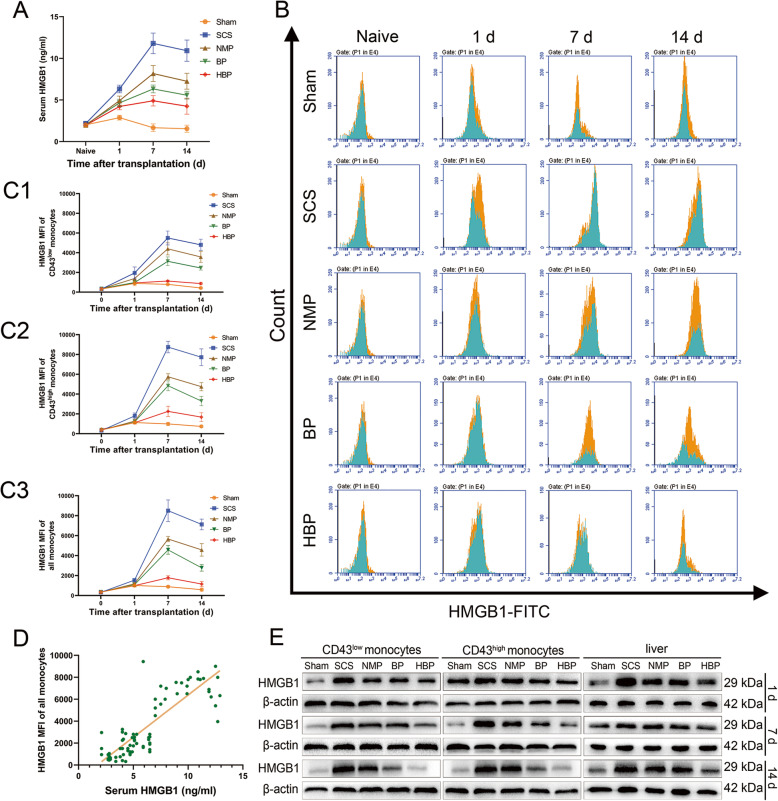
Fig. 8.
Serum HMGB1, MFI of HMGB1 on monocytes, and HMGB1 expression in liver grafts. A Serum HMGB1 level. The serum HMGB1 level in the HBP group was lower than that in the SCS, NMP, and BP groups (P < 0.05). B MFI of HMGB1 expression on CD43low monocytes (blue) and CD43high monocytes (yellow). C1 MFI of HMGB1 on CD43low monocytes. C2 MFI of HMGB1 on CD43high monocytes. C3 The MFI of HMGB1 on all monocytes in the HBP group decreased slowly after an increase on day 1, stabilized to near-normal levels on day 14, and was lower than that in the BP group (P < 0.05). The MFI of HMGB1 on all monocytes in the SCS group was significantly higher than those in the other groups at each time point (P < 0.05). D Correlation analysis. A strong positive correlation was observed between serum HMGB1 levels and the MFI of HMGB1 on all monocytes after OLT (r = 0.7931, P < 0.0001). E The protein expression of HMGB1 in monocytes and liver tissues. (aP < 0.05 vs. SCS group; bP < 0.05 vs. NMP group; cP < 0.05 vs. HBP group)

