Fig. 1.
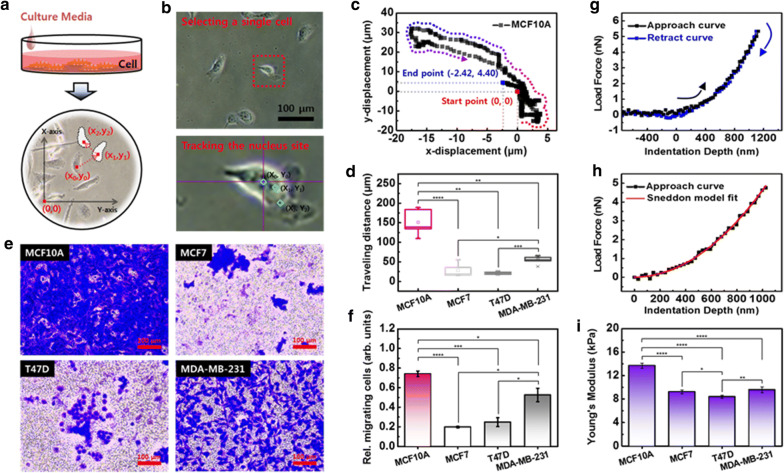
Cell movement in 2D and 3D conditions, and cellular elasticity. a Schematic diagram of a single cell tracking system using an optical microscope. Two-dimensional cell movement was tracked in Cartesian coordinates at 1 min intervals for 8 h. b At each time point, the cell location was determined based on the nucleus. c Cell displacement was converted to a scalar quantity. d Comparison between cells of traveling distance on a 2D substrate. e Three-dimensional migration ability was evaluated with a transwell membrane assay. The cells migrated through an 8 µm pore were stained in blue. f Relative number of migrated cells. g Representative FD curve of the deformable cells. The approach and retraction curve are marked with black and blue rectangular points, respectively. h Approach curve was fitted to the Sneddon model to obtain the Young’s modulus of the cell. i Determined Young’s modulus of the cells. Each value represents mean ± SEM (*p ≤ 0.05, **p ≤ 0.01, ***p ≤ 0.001, ****p ≤ 0.0001)

