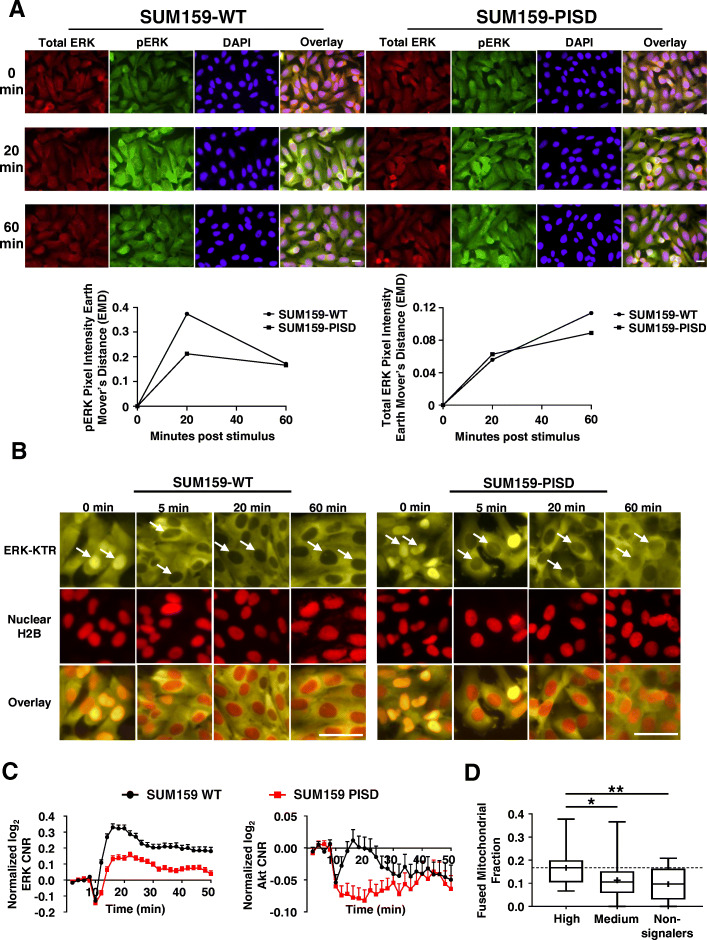
Fig. 3.
Elevated expression of PISD reduces signaling to ERK. a Representative overlaid images of immunofluorescence staining of total (red) ERK, phosphorylated (green) ERK, and DAPI (nuclei, blue) in SUM159-WT and PISD cells at the initial time point (0 min) and 20 and 60 min after addition of serum (10%). PISD cells exhibit reduced amplitude and duration of phosphorylated ERK (decreased green in the overlaid images at 20- and 60-min time points). Scale bar is 20 μm. Bottom: Graphs show earth mover’s distance (EMD) of the green intensity (pERK, left) or red intensity (total ERK, right) between each time point after addition of stimulus (10% serum) relative to the initial time point for Akt (n = 5 images per group). b Fluorescence images of ERK KTR (yellow) and nuclear H2B-mCherry (red) in SUM159-WT and PISD cells at the initial time point (0 min) and 5, 20, and 60 min after addition of 10% serum show translocation of yellow fluorescence out of the nucleus (arrows, darker nucleus = ERK activation). Scale bar = 50 μm. c Graphs show mean + SEM for activation of Akt and ERK in response to serum, expressed as log2 of cytoplasmic/nuclear fluorescence intensities normalized to time 0 for an average cell in each cell type. d Box plot and whiskers for the fraction of fused mitochondria in high, medium, or non-signaling SUM159-WT cells demonstrates enhanced signaling in response to serum in cells with a higher fraction of fused mitochondria. Line within the box denotes the median, and the “+” symbol denotes the mean. Dashed line represents the median fused fraction in high signaling cells (n = 96). *p < 0.05. **p < 0.01

