Fig. 5.
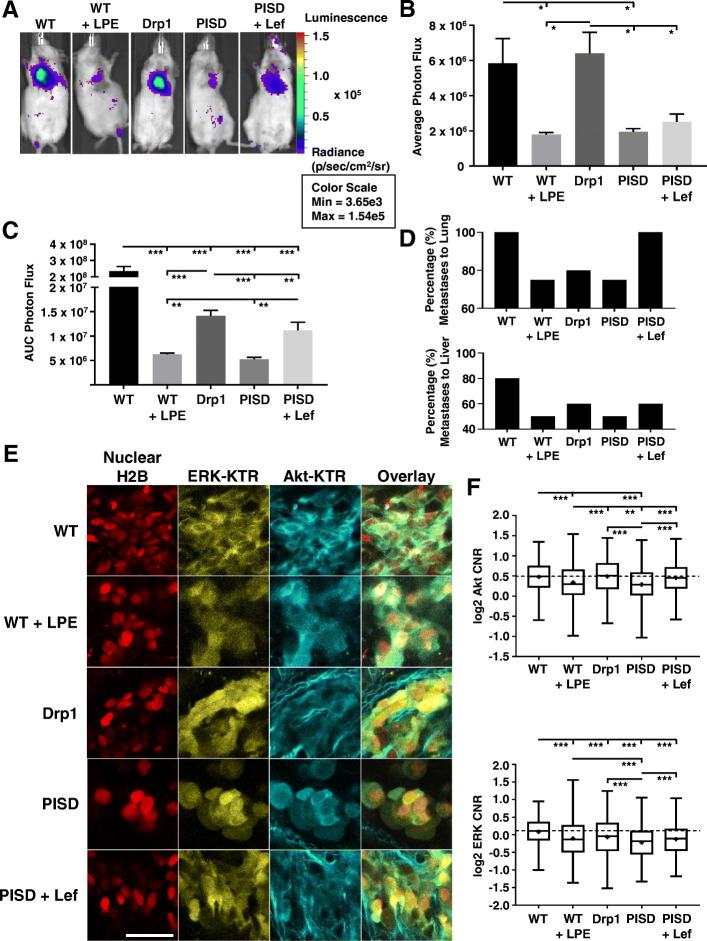
Mitochondrial fission inhibits systemic metastases and oncogenic signaling in vivo. a Bioluminescence images of mice 1 day after intracardiac injection with SUM159-WT, WT treated with α-lysophosphatidylethanolamine (LPE, 50 μM), PISD, PISD treated with leflunomide (Lef, 50 μM), or Drp1 cells. b Graph shows mean + SEM photon flux values 1 day after injection (n ≥ 4 mice per group). *p < 0.05. c Mean + SEM for area-under-the-curve (AUC) analysis of photon flux for metastases over 20 days for SUM159 cells described in panel a. **p < 0.01. ***p < 0.0001. d Graphs display percentages of mice in each group (n ≥ 4 mice per group) with metastases to the lung (top) and liver (bottom). e Ex vivo fluorescence images of ERK KTR (yellow), Akt KTR, (cyan), and nuclear H2B-mCherry (red) in lung metastatic cells from intracardiac injection with SUM159-WT, WT + LPE, PISD, PISD + Lef, and Drp1 cells. Scale bar = 50 μm. Second harmonic signal shows collagen fibers (cyan) surrounding cells. f Box plot and whiskers for quantified log2 cytoplasmic/nuclear fluorescence intensities for Akt (top) and ERK (bottom) activities based on the ex vivo imaging of KTRs in lung metastases from each group (n ≥ 412 cells per group) in e. Line within the box denotes the median, and the “+” symbol denotes the mean. Dashed line represents the median of WT cells. **p < 0.01, ***p < 0.0001. Data demonstrate reduced activation of Akt and ERK from interventions that increase mitochondrial fission prior to injection (LPE treatment of WT cells) or stably throughout the experiment (PISD and Drp1)

