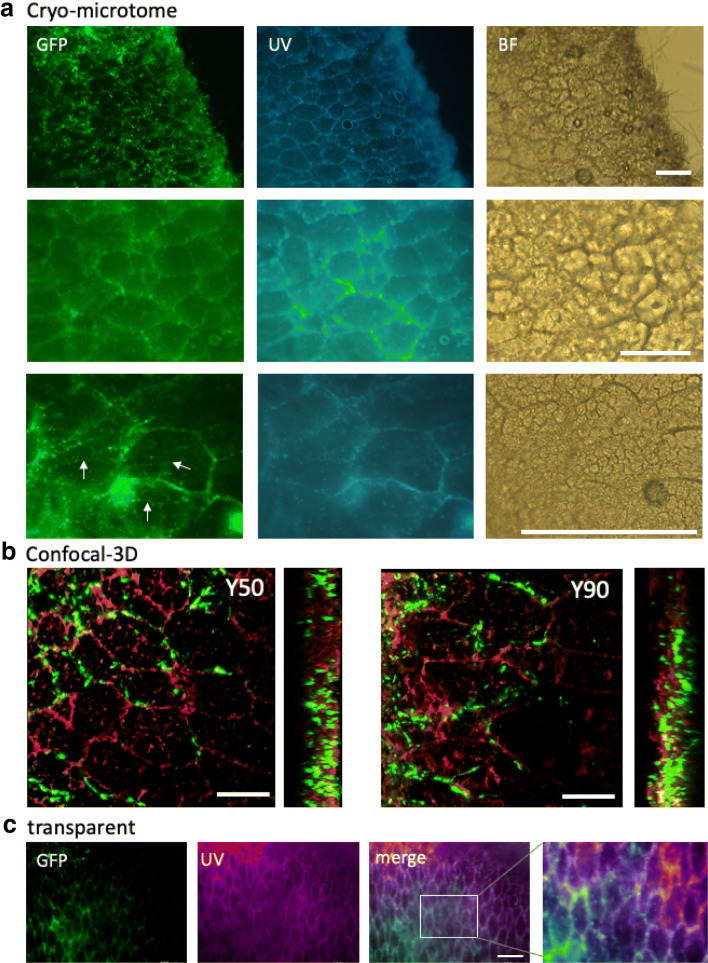
Fig. 2.
Fluorescent imaging analysis of A. oryzae penetration inter-rice cells and intra-rice cells. a Fluorescent images of A. oryzae (H2B-GFP) penetration inter-rice cells and intra-rice cells in Y50. The rice cells were shown by UV and BF (bright field). The sections were sliced by cryo-microtome. Hyphal growth inside of rice cells was indicated by arrows. Scale bars: 50 μm. b Confocal-3D imaging of the koji section from Y50 and Y90. A. oryzae (green), rice cells visualized by the autofluorescence (red). See also Additional files 2, 3: Movies S1 and S2. Scale bars: 50 μm. c The koji treated with the transparent reagent were imaged by fluorescent microscopy. A. oryzae (green), rice cells (purple). Scale bar: 100 μm

