Fig. 5.
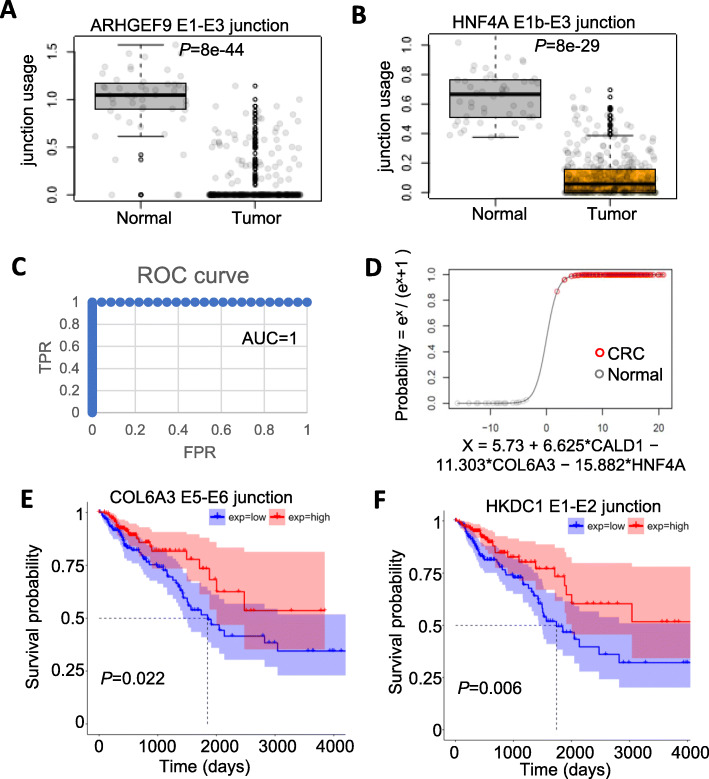
Splicing events validated by TCGA data and potential value in cancer diagnosis and overall survival (OS). a-b Boxplots of junction usage of ARHGEF9 E1-E3 junction (a) and HNF4A E1b-E3 junction (b) in 51 normal tissue and 382 CRC or metastatic tissue (tumor). P-values are based on Wilcoxon rank-sum test adjusted using Bonferroni correction. Dots in the boxplot represent the individual patient in TCGA. c Receiver operating characteristic (ROC) curve of a logistic regression model using junction usages from three genes (CALD1, COL6A3, HNF4A) as predictors and sample type (normal, value = 0 or CRC, value = 1) as the dependent variable. Area Under Curve (AUC) is shown. d Logistic regression curve of the model as shown in C. X axis is the logit (log odds) function. Y axis is the predicted probability of the sample type. Only the testing data (not used in the training process) were used in the plot. The actual sample types were shown as red and gray circles for CRC and normal respectively. e-f Survival curves of 357 patients with overall survival data equally separated into two groups (low and high) based on junction usage of COL6A3 E5-E6 (e) and HKDC1 E1-E2 (f). P-value is based on the log-rank test. Confidence intervals were shown as shaded areas

