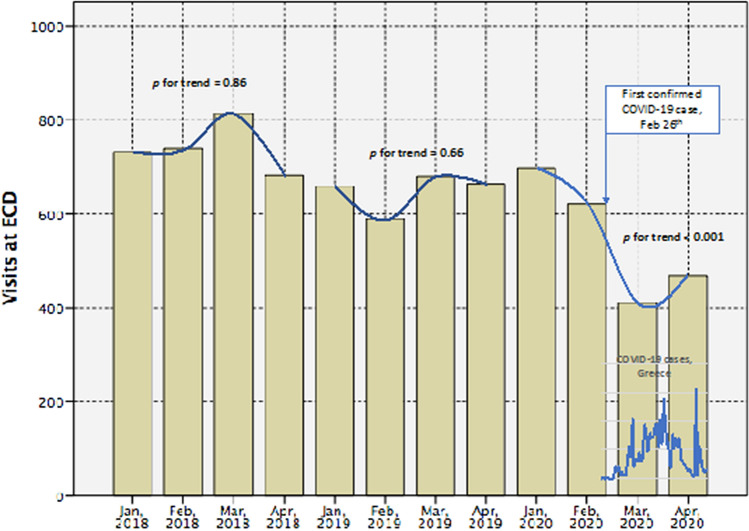
Fig. 1.
Monthly unscheduled visits at the ECD of a tertiary General Hospital, during January 2018–April 2020 (p-values derived from linear trend analysis, lines derived from fractional polynomials per year of study); time-series line (bottom right) represent the confirmed COVID-19 cases in Greece, from February 26th to April 30th, 2020 (note: the peak observed on April 21st is due to a series of cases observed in a refugee/immigrants campus)

