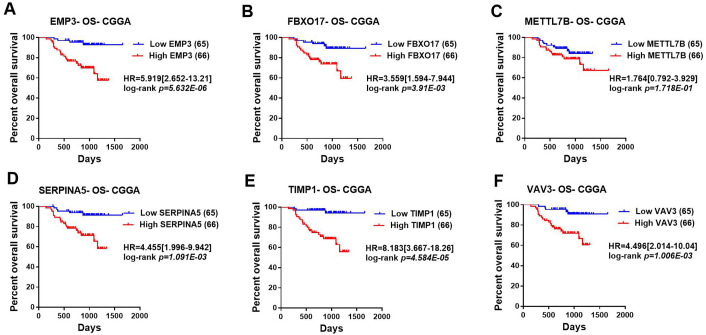
Figure 3. Correlation between the top six significant changed genes’ expression and patients’ survival in lower-grade glioma with CGGA dataset.
(A–F) Kaplan–Meier plot for overall survival between patients with high level and low level of EMP3, FBXO17, METTL7B, SERPINA5, TIMP1, VAV3 mRNA expression in CGGA dataset.

