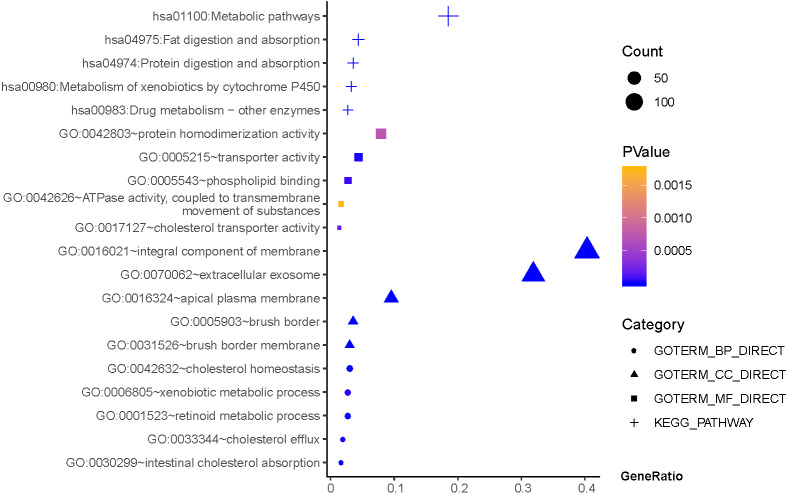
Figure 3. The functions and pathway analysis of DEGs in H.pylori-associated AG-IM.
Results of GO and KEGG enrichment analysis of the 385 genes between Hp+-NAG and Hp+-AG-IM. Ordinate is the enriched functions and pathway, and abscissa is the ratio of the DEGs. The area of the displayed graphic is proportional to the number of genes assigned to the term and the color corresponds to the P value.

