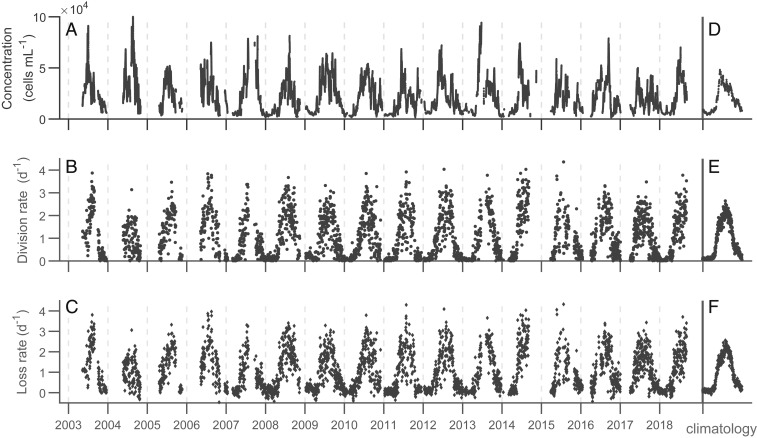
Fig. 1.
Daily measurements between 2003 and 2018. (A) Cell concentration is a 48-h running average. (B) Division rate is computed by comparing initial and final population sizes in each day’s simulation, and (C) loss rate is calculated by subtracting the observed net growth rate from the division rate. (D–F) Climatological values are the averages for each day of the year across all years in the time series. Only dates with at least 23 h of FlowCytobot observations are included in this analysis (n = 3,200).

