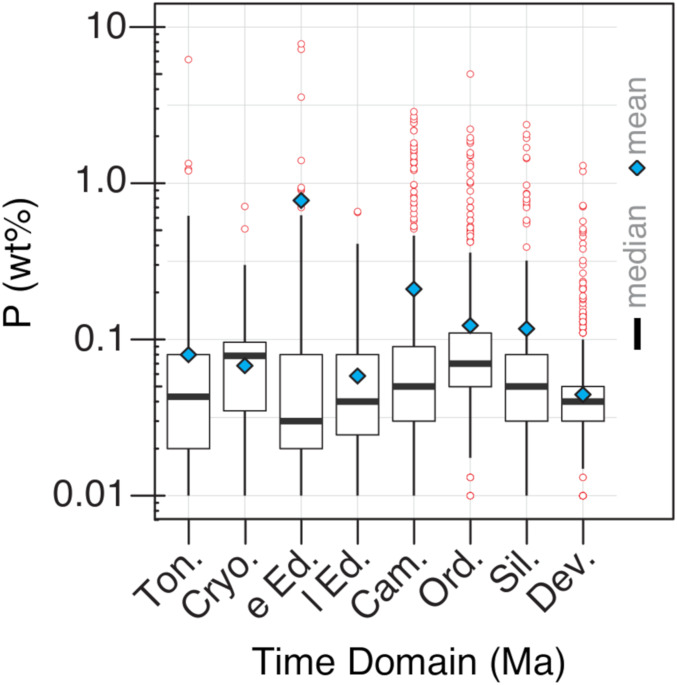
Fig. 2.
The phosphorus content of Neoproterozoic and lower Paleozoic sedimentary rocks, including new P measurements as well as published compilations (45). The data are plotted as a box and whisker plot: Center lines indicate medians, boxes the inner quartiles, and whiskers 1.5 times the interquartile range. Outliers falling beyond the whiskers are shown as red dots; these include phosphorites as defined in ref. 25 (wt % P2O5 >18%). The mean value is also included for each bin and denoted as a blue diamond. A full analysis of all geological time is available in SI Appendix. Pairwise comparison of time bins demonstrates that most time bins are significantly different—not unsurprising given the large number of samples. This gives confidence that the small effect sizes seen are an accurate reflection of the geologic record and not a sampling effect. Dev: Devonian; Sil.: Silurian; Ord.: Ordovician; Cam.: Cambrian; l. Ed.: late Ediacaran; e. Ed.: early Ediacaran; Cryo.: Cryogenian; Ton.: Tonian.

