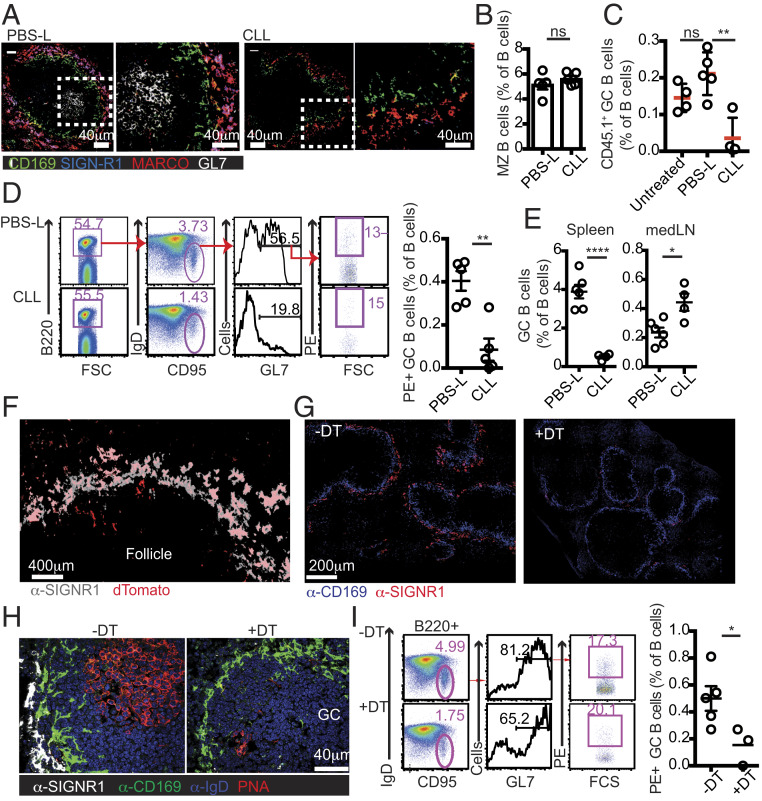
Fig. 2.
Depletion of SIGN-R1 macrophages impairs GC B cell responses. (A–E) CLL or PBS-L were infused i.v. to recipient mice at 3 wk before the cotransfer of OTII T cells and CD45.1+ MD4 B cells, followed by HEL-OVA immunization. Spleens were analyzed 8 d later. (A) IF analysis of immunized PBS-L– and CLL-treated mice. White boxes indicate the high-magnification views shown on the right. (B) Frequencies of MZ B cells. (C) Frequencies of HEL-specific GC B cells. Data in A–C represent one out of at least five independent experiments performed. “Untreated” are immunized mice that did not receive CLL or PBS-L (D) Mice were treated with CLL or PBS-L and 3 wk later immunized i.p. with PE in Ribi adjuvant. (Left) Gating strategy to determine the frequency of PE+ GC B cells. (Right) Frequency of PE-specific GC B cells in the B cell compartment at 10 d postimmunization. Data represent one out of three independent experiments. (E) GC B cell frequencies in the spleen (Left) and mediastinal LNs (Right) of mice treated with PBS-L or CLL at 3 wk before intranasal infection with influenza virus. GC B cells were identified at 10 d postinfection as B220+IgDlowFAS+GL7+ live cells. Data represent one of two independent experiments. (F) IF analysis of spleen sections from SIGN-R1-Cre/DTR+/−dTomato+/− mice. (G) Spleens from SIGN-R1-Cre/DTR+/− mice treated or untreated with DT. (H and I) GC B cell responses in spleens from DT-treated or untreated SIGN-R1-Cre/DTR+/− mice analyzed at 7 d postimmunization with PE. (H) IF analysis with staining as indicated. (I) Gating strategy (Left) and frequencies (Right) of PE-specific GC B cells. Data are from one representative experiment out of three performed. Sections analyzed in A and F–H were from at least three mice per group per experiment.

