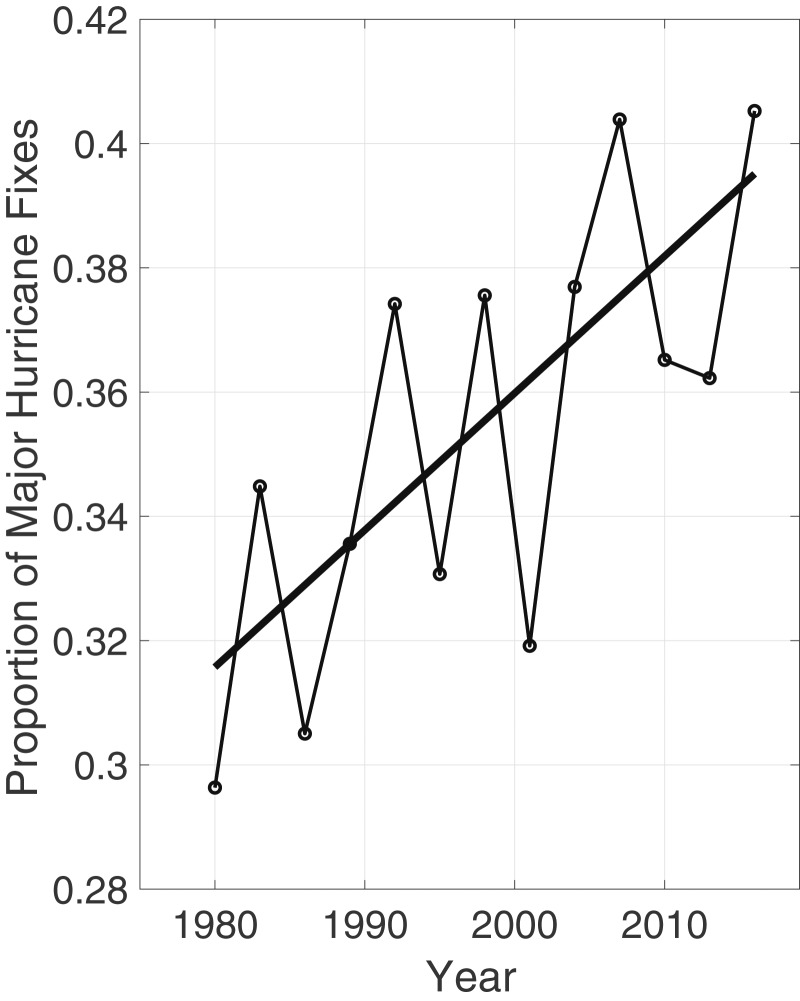
Fig. 2.
Time series of fractional proportion of global major hurricane estimates to all hurricane estimates for the period 1979–2017. Each point, except the earliest, represents the data in a sequence of 3-y periods. The first data point is based on only 2 y (1979 and 1981) to avoid the years with no eastern hemisphere coverage. The linear Theil−Sen trend (black line) is significant at the 98% confidence level (Mann−Kendall P value = 0.02). The proportion increases by 25% in the 39-y period (about 6% per decade).

