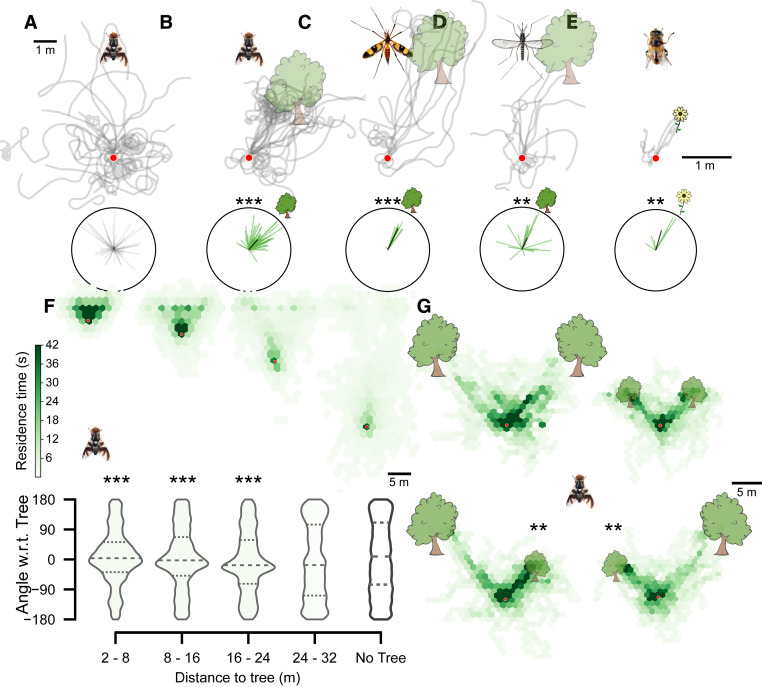
Fig. 2.
Response of tethered insects to virtual objects of varying sizes and distances. (A and B) Virtual trajectories of R. pomonella (apple fly) to worlds with no tree (A) and a tree on the right (B), at a 3-m virtual distance (n = 11 flies, n = 103 trials). (C) Virtual trajectories of P. laeta (crane fly) to a tree on the right, at a 4-m virtual distance (n = 6 flies, n = 15 trials). (D) Virtual trajectories of A. aegypti (yellow fever mosquito) to a tree on the right, at a 3-m virtual distance (n = 6 flies, n = 13 trials). (E) Virtual trajectories of E. tenax (hoverfly) to a 1-m-high flower on the right, at a 1-m virtual distance (n = 2 flies, n = 6 trials). All polar plots provide corresponding mean angles for each trajectory, with the black line indicating total mean. (F) Hexbinned plots of apple fly trajectories against trees placed at 3, 6, 12, and 24 m from the initial position (n = 20 flies, n = 129 trials). Violin plots indicate angles with respect to (w.r.t.) the tree at different distance bins. (G) Hexbinned plots of apple fly trajectories against large distant trees vs. small nearby trees that subtend identical visual angles at the initial position (n = 9 flies, n = 96 trials). **P < 0.01, ***P < 0.001. Rayleigh test for B and C and binomial test for D. Red circles indicate the starting position.

