Fig. 3.
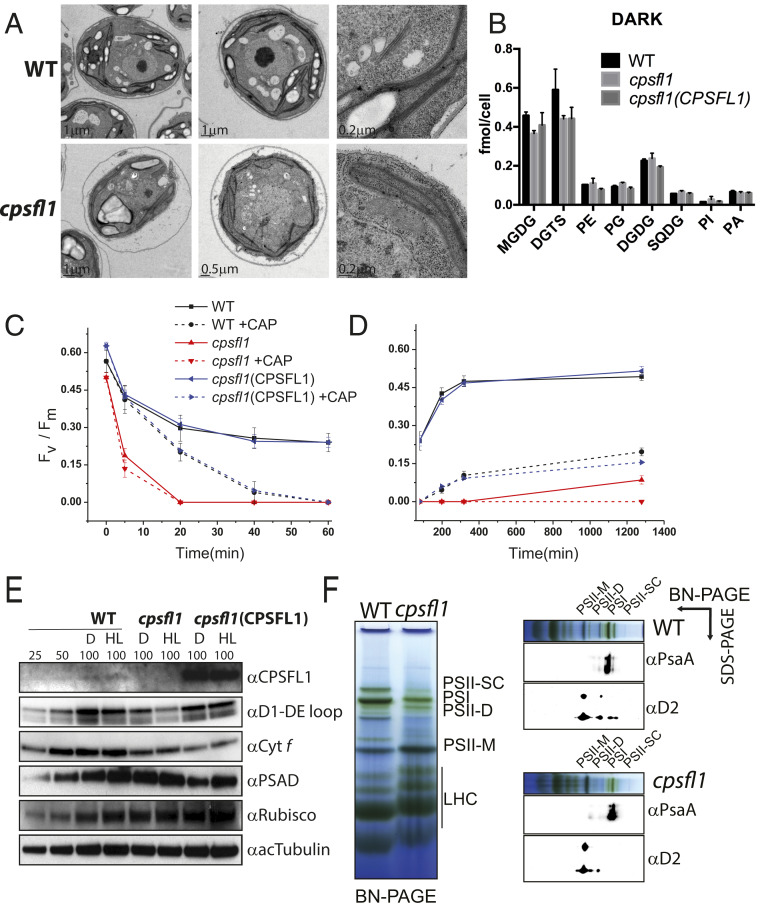
Analyses of TM structure, lipid composition, and photosystem organization in cpsfl1. (A) TEM images of different cell sections of dark-grown WT (Upper) and cpsfl1 mutant cells (Lower). (B) Lipid profiles of WT, cpsfl1, and cpsfl1(CPSFL1) complemented cells grown in the dark. Error bars represent means ± SD (n = 3). DGDG, digalactosyldiacylglycerol; MGDG, monogalactosyldiacylglycerol; SQDG, sulfoquinovosyldiacylglycerol. (C–E) Photoinhibition analysis of cpsfl1. Dark-grown WT, cpsfl1, and complemented cpsfl1(CPSFL1) cells were shifted to HL (800-µmol photons m−2 s−1) for 1 h (C) and recovered in the dark for 20 h (D) in the absence or presence of chloramphenicol (CAP). PSII activity as assessed by measuring PSII maximum quantum efficiency (Fv/Fm) after 5, 20, 40, and 60 min during the HL treatment and after 2, 4, and 20 h during recovery in the dark. Error bars represent means ± SD (n = 3). (E) Immunoblot analyses of dark-grown (D) and 1 h HL-treated cells (HL). Loading of 100% corresponds to ∼1 × 10⁶ cells. (F) First-dimension BN-PAGE analysis of solubilized TM protein complexes isolated from dark-grown cells and immunoblot analyses against PSII-D2 and PSI-PsaA subunits in the second denaturing dimension. PSII-D, PSII dimer; PSII-M, PSII monomer; PSII-SC, PSII-LHCII supercomplexes.

