Fig. 5.
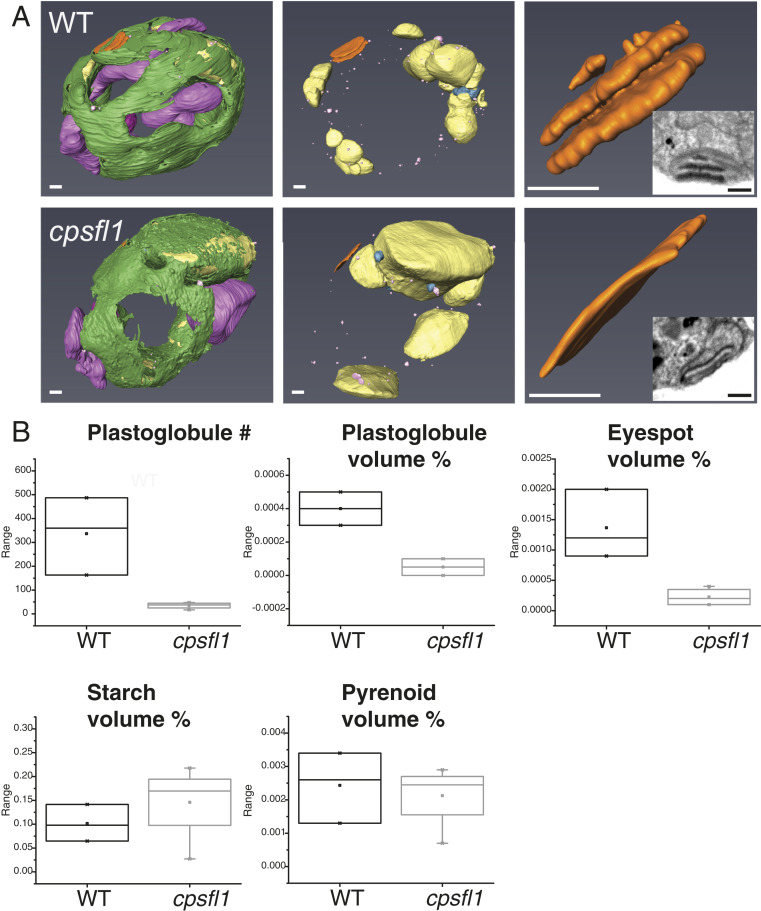
FIB-SEM 3D ultrastructural analysis of WT and cpsfl1 cells. (A) Three-dimensional models based on the FIB-SEM densities of dark-grown representative WT (Upper) and cpsfl1 mutant (Lower) cells. In green, TM; purple, mitochondria; yellow, starch granules; pink, plastoglobules; and orange, eyespot. (See also Movies S1 and S2). (B) Box plots of, from left to right and top to bottom, number, and relative volume (in percent of total cell volume) of plastoglobules, eyespot, starch granules, and pyrenoid, measured in the FIB-SEM densities. (Scale bars, 500 nm.)

