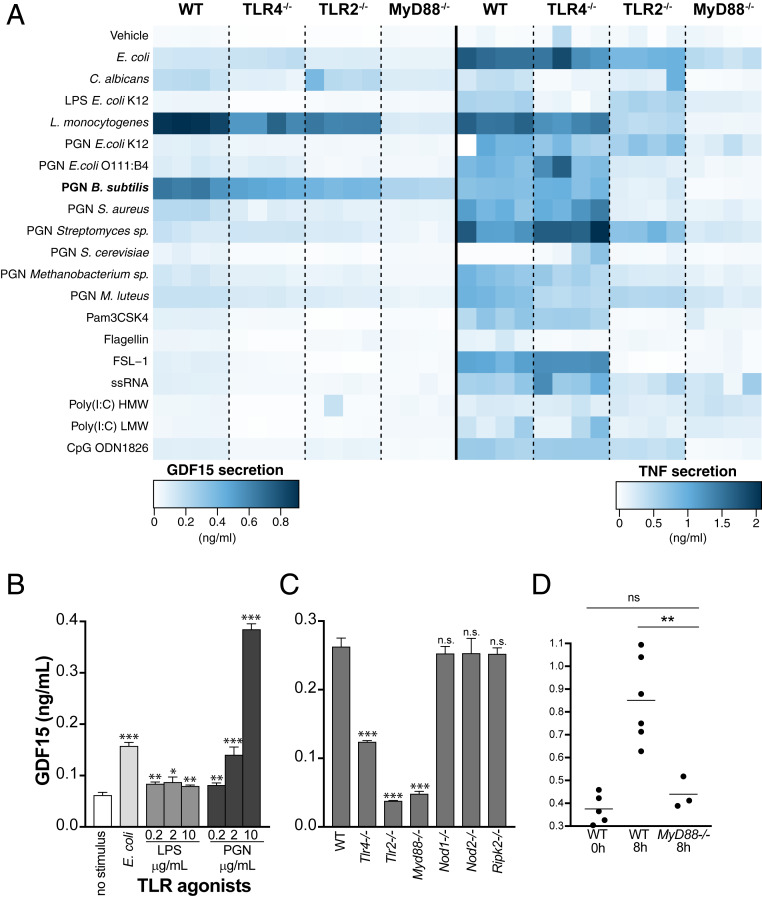
Fig. 2.
GDF15 is induced by PGN through a TLR2-Myd88 pathway in mice. Quantification by ELISA of GDF15 and TNF secretion induced by TLR agonists in BMDMs. (A) GDF15 and TNF levels in conditioned media following incubation of BMDMs from WT or knockout animals (Tlr4−/−, Tlr2−/−, and Myd88−/−) for 24 h without stimulus or with a series of TLR agonists. TLR agonists and concentrations: PFA-fixed E. coli at 20 bacteria per cell; PFA-fixed C. albicans at 20 yeast per cell; LPS from E. coli at 200 ng/mL; Listeria monocytogenes at 100 × 106 bacteria/mL; PGN from a variety of microbial sources at 10, 5, and 2.5 μg/mL; Pam3CSK4 at 300 ng/mL; flagellin from Salmonella typhimurium at 1 μg/mL; FSL-1 (Pam2CGDPKHPKSF) at 100 ng/mL; ssRNA40 at 2.5 μg/mL; Poly(I:C) HMW at 10 μg/mL; Poly(I:C) LMW at 10 μg/mL; and CpG oligonucleotide at 1.5 μM. (B) GDF15 levels in conditioned media following incubation of WT BMDMs for 24 h without stimulus or with the following TLR agonists: PFA-fixed E. coli at a ratio of 20 bacteria per cell, LPS from E. coli at 0.2 to 10 μg/mL, and PGN from B. subtilis at 0.2 to 10 μg/mL. (C) GDF15 levels quantified as in B, following incubation of BMDMs from WT or knockout animals (Myd88−/−, Tlr2−/−, Tlr4−/−, Nod1−/−, Nod2−/−, and Ripk2−/−) for 16 h with PGN 2.5 μg/mL. Averages and SDs are shown for three replicate wells in 96-well plates; one representative experiment is shown, and at least three independent experiments were performed and quantified by ELISA. (D) GDF15 levels at 8 h after CLP in the peripheral blood of WT and MyD88−/− mice. Each circle represents an individual mouse. n.s., not significant; *P < 0.05; **P < 0.01; ***P < 0.001.

