Fig. 6.
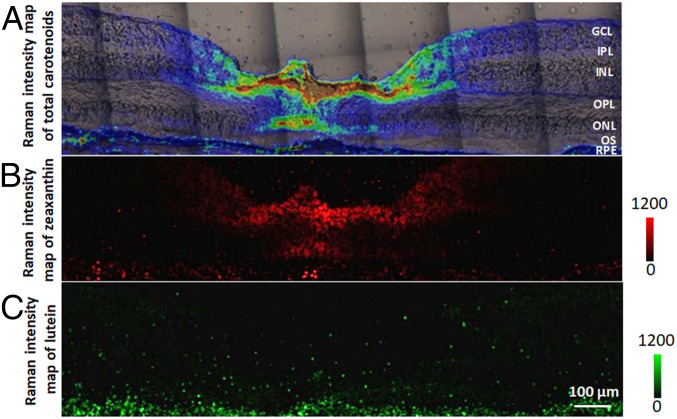
Distributions of zeaxanthin and lutein in a human retinal section. (A) An overlaid image of the total carotenoid map and microscopic image originally shown in Fig. 4. (B) An intensity map of zeaxanthin generated using CLS fitting. (C) An intensity map of lutein generated using CLS fitting.

