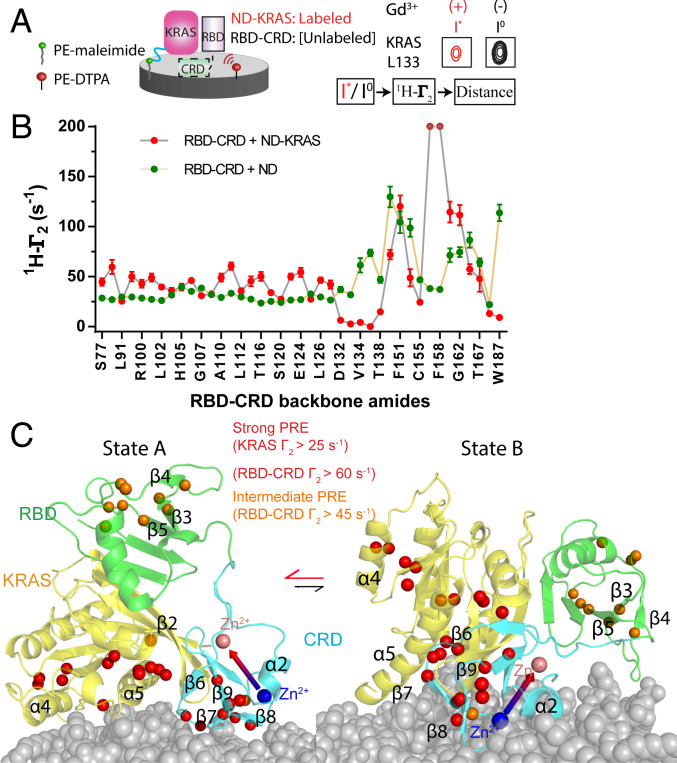
Fig. 3.
Mapping the membrane association interface of the MC-KRAS:RBD–CRD complex. (A) Schematic diagram of the experimental system to determine membrane interfaces of MC-KRAS:RBD–CRD. Gd3+ was chelated on a lipid head group and incorporated into a nanodisc-bound lipid bilayer. The resulting PRE on KRAS and RBD–CRD (alone and in complex) identified residues proximal to the membrane surface (e.g., KRAS L133, Right). Functionalized lipids 1,2-distearoyl-sn-glycero-3-phosphoethanolamine (PE)-N-diethylenetriaminepentaacetic acid (DTPA, red) and PE-maleimide (green) were used to chelate Gd3+ or crosslink KRAS, respectively. (B) Estimated 1HN-Γ2 rates induced by Gd3+ on amide resonances of RBD–CRD in the presence (red) or absence (green) of KRAS tethered to the nanodisc (ND). (C) Structural models of the KRAS:RBD–CRD complex on the membrane. Isotopic probes are shown in orange and red according to severity of broadening. State A represents a major cluster based on strong PRE restraints while state B represents an alternate conformation that satisfies restraints from intermediate PRE effects. Two CRD bound zinc ions are shown as large spheres colored pink or blue and connected by an arrow to indicate the orientation of CRD.

