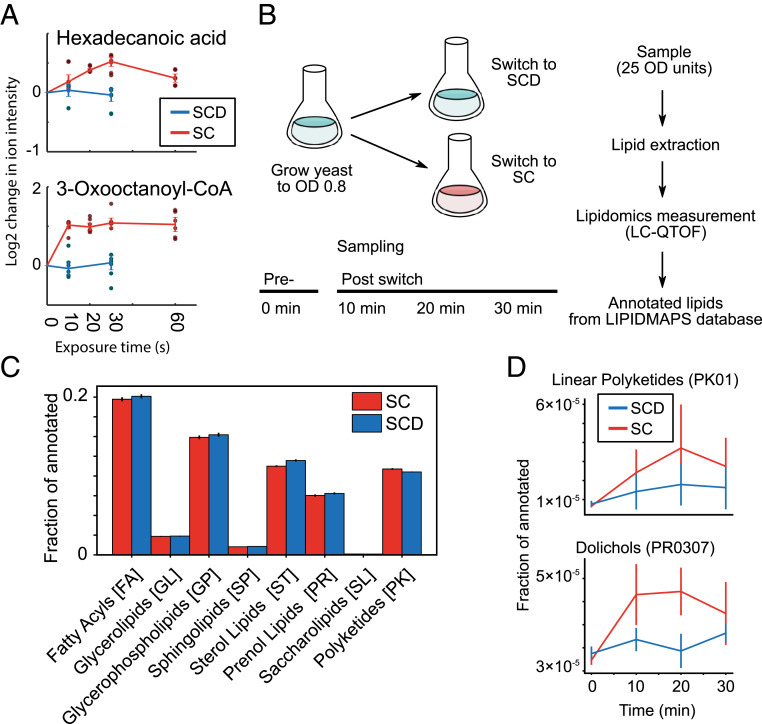
Fig. 5.
The lipidome during rapid starvation. (A) Hexadecanoid acid and 3-oxooctanoyl-CoA as examples of lipid-related metabolites that accumulate within 10 to 60 s. The log2-adjusted values of intensity for specific ions are shown and labeled according to the annotated compound. Measurement time indicates the exposure time for the given media for the cells on the filter (SCD, blue; SC, red). Six dots are shown for each time point (three biological replicates and two technical measurement replicates). Time point 0 s is extrapolated from the average of the SCD condition. Error bars indicate the SE for three biological replicates. (B) Experimental setup for measuring yeast lipidomics upon starvation entry. Exponentially growing yeast cells (OD 0.8 in SCD media) were sampled (time point 0 min) and then resuspended in fresh SCD or SC media. Samples were taken every 10 min thereafter. All samples were processed (see Methods) and measured. Putative lipids were annotated based on m/z and correspondence to the LIPID MAPS database. (C) The normalized distribution of annotated lipids using the LIPID MAPS identifiers. The eight major lipid categories are shown. Error bars indicate the SE between two biological replicates. (D) The lipid classes linear polyketides (PK01) and dolichols (PR0307) were identified as accumulating in glucose starvation compared to nutrient-rich conditions. Error bars indicate the SE between two biological replicates.

