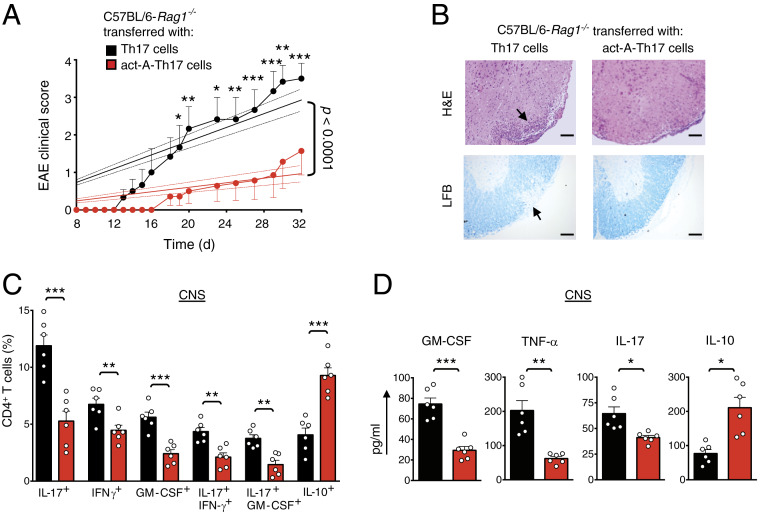
Fig. 3.
Activin-A suppresses Th17 cell encephalitogenicity. (A) EAE disease scores of C57BL/6-Rag1−/− mice reconstituted with CD4+ T cells from CFA/MOG-immunized mice and restimulated for 3 d with MOG35–55, IL-23, and activin-A (act-A–Th17 cells) or PBS (Th17 cells). Regression analysis of the clinical scores is also shown. Dashed lines indicate the 95% confidence intervals of the regression lines. Statistical significance was obtained by two-way ANOVA, followed by Bonferroni’s multiple comparisons test (n = 6 mice per group). (B) Representative hematoxylin/eosin (H&E) staining on spinal cord sections. LFB, Luxol Fast Blue. (Scale bars, 50 μm.) (C) Cumulative data showing the percentages of CNS-infiltrating cytokine-producing CD4+ T cells. Each symbol represents an individual mouse. Data are mean ± SEM (n = 6 mice per group). (D) Cytokine release in spinal cord homogenates. Data are mean± SEM of triplicate wells (n = 6 mice per group). Statistical significance was obtained by Student’s t test; *P < 0.05, **P < 0.01, and ***P < 0.001. Data displayed represent one of two independent experiments.

