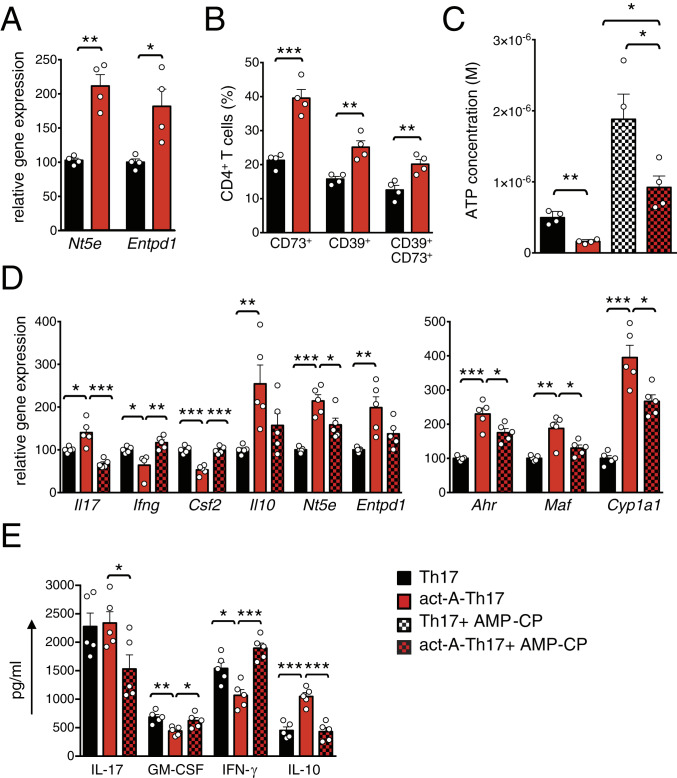
Fig. 4.
CD73 signaling is essential for activin-A–mediated repression of the pathogenic Th17 profile. (A) The expression of Nt5e and Entpd1 was analyzed by qPCR and normalized to Gapdh and Polr2a, in act-A–Th17 or Th17 cells. Each symbol represents the mean ± SEM of duplicate wells and corresponds to one of four independent in vitro experiments. (B) Cumulative data showing CD39 and CD73 expression, gated on CD4+ T cells. Each symbol represents one of four independent in vitro experiments. (C) ATP levels in culture supernatants are shown. Data are mean ± SEM of triplicate wells, each symbol represents one of four independent in vitro experiments. (D) Gene expression was analyzed by qPCR and normalized as above. Each symbol is the mean ± SEM of duplicate wells and corresponds to one of five independent experiments. (E) Cytokine release in culture supernatants. Each symbol is the mean ± SEM of triplicate wells and corresponds to one of five independent in vitro experiments. Statistical significance was obtained by Student’s t test; *P < 0.05, **P < 0.01, and ***P < 0.001.

