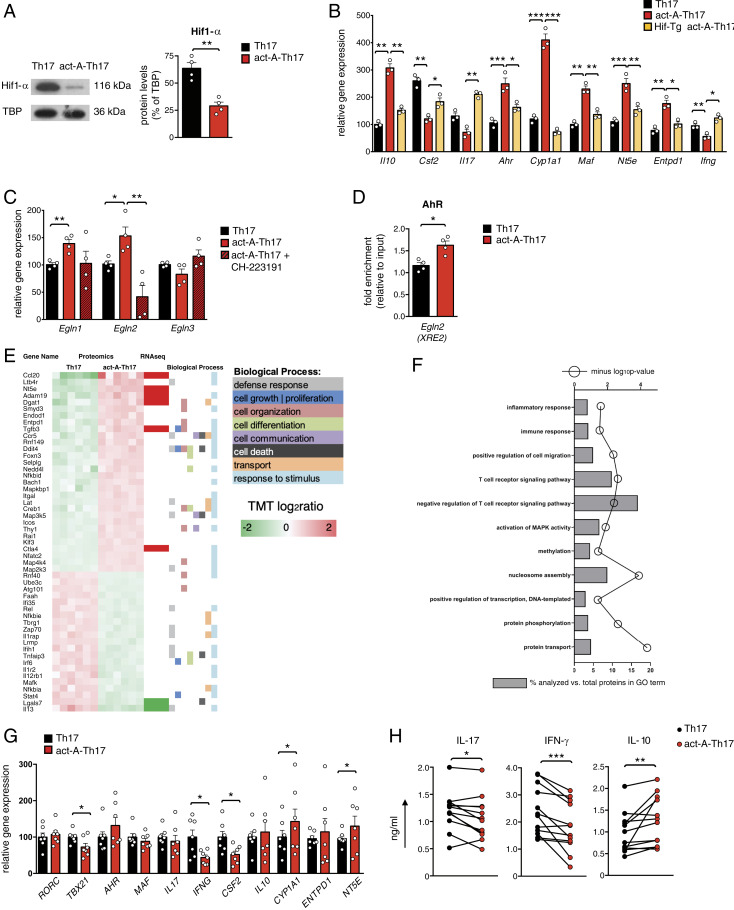
Fig. 8.
Hif1-α suppression is crucial for activin-A–mediated modulation of the pathogenic Th17 cell signature. (A) Representative immunoblots showing Hif1-α expression. Quantification of relative Hif1-α protein levels are depicted; TATA binding protein (TBP). Data are mean ± SEM; each symbol corresponds to one of four independent in vitro experiments. (B) Gene expression of act-A–Th17 or Th17 cells from C57BL/6 or Hif1-Tg/CD4 mice was analyzed by qPCR and normalized to Gapdh. Each symbol represents the mean ± SEM of triplicate wells and corresponds to one of three independent in vitro experiments. (C) Act-A–Th17 or Th17 cells were differentiated in the presence of CH-223191 or DMSO. Gene expression was analyzed by qPCR and normalized to Gapdh and Polr2a. Each symbol is the mean ± SEM of duplicate wells and corresponds to one of four independent in vitro experiments. (D) ChIP analysis demonstrates the binding of AhR on the XRE2 site in the Egln2 locus. Results are mean ± SEM; each symbol corresponds to one of four independent in vitro experiments. (E) Heatmap of DEPs in act-A–Th17 cells vs. Th17 cells, along with the biological processes they participate. The proteomics dataset was aligned with the RNA-seq dataset and a subset of the DEPs was verified to exhibit differential expression at the mRNA level. (F) GO analysis of DEPs in act-A–Th17 cells. (G) Naive CD4+ T cells from RRMS patients were polarized toward the Th17 cell lineage, as indicated. Gene expression was analyzed by qPCR and normalized to B2M. Data are mean ± SEM of duplicate wells; each symbol depicts an individual donor (n = 7 donors). (H) Cytokine release in culture supernatants. Each symbol represents the mean ± SEM of triplicate wells and corresponds to an individual donor (n = 12 donors). Statistical analysis was performed by unpaired Student’s t test and Wilcoxon matched-pairs signed rank test; *P < 0.05, **P < 0.01 and ***P < 0.001.

