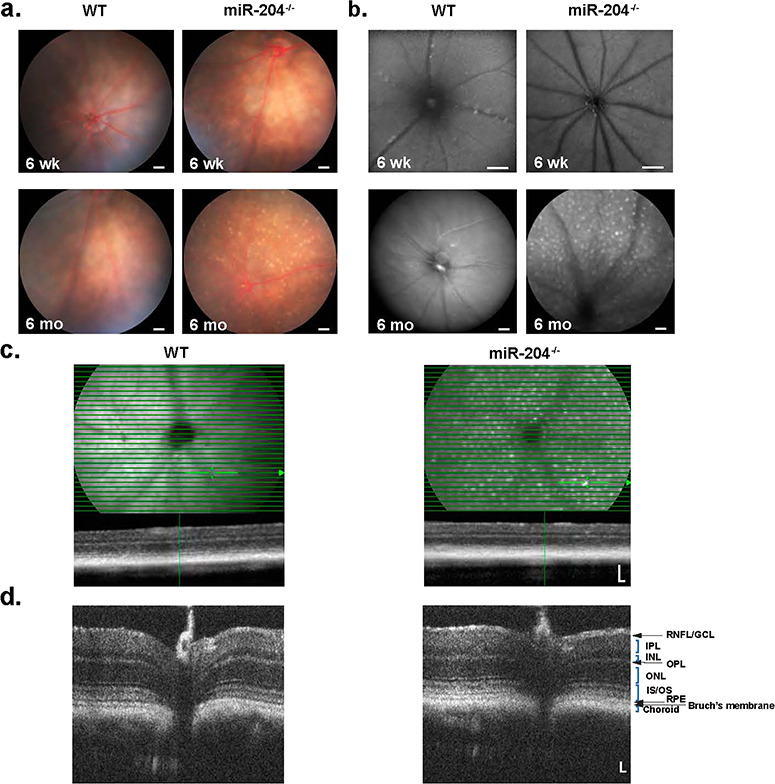
Figure 1.

Fundus, AF and OCT images of WT and miR-204−/− mice. (a) Fundus images of 6-week-old mice show no abnormalities in WT (a, left) or miR-204−/− mice (a, right). However, 6-month-old miR-204−/− mice (a, lower right) show ocular spots, indicating damage to the RPE compared to WT (a, lower left). Scale bar, 200 μm. (b) FAF images at 6 weeks (b, upper) and 6 months (b, lower) show progressively increased AF deposits in the mir-204−/− compared to WT. Scale bar, 200 μm. (c) OCT images of 9-month-old WT (left panel) and miR-204−/− mice (right panel) show normal profiles and no obvious change in retinal structure. Scale bar, 100 μm. Thin horizontal lines indicate OCT scans, and image below is a transverse retinal section (Scale bar, 100 μm) at the location indicated by the cursor. The corresponding retinal anatomical structures are labeled. (d) HR OCT retinal images of WT and miR-204−/− reveal anatomical similarities in the thickness of the intraretinal layers identifiable by their hyperreflective bands.
