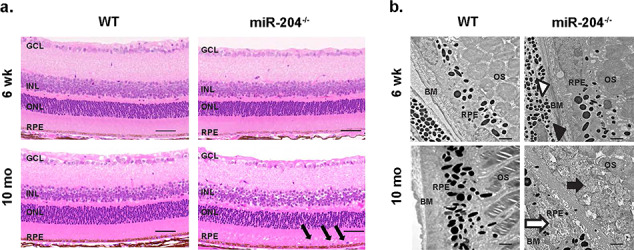
Figure 2.

Abnormal subretinal deposits in miR-204−/− mice. (a) Light microscopic images of H&E stained 5 μm histological sections from WT (left) and miR-204−/− mice (right) at 6 weeks (top) and 10 months (bottom) displaying progressive changes in RPE cell junction integrity. The anatomic layers of the retina are labeled including the GCL, INL, and outer nuclear layers (ONL), in addition to the neighboring RPE. Black arrows mark abnormal cells in the SRS among misaligned outer segments. Scale bar, 50 μm. (b) Transmission electron micrograph images of the photoreceptor-RPE-choroid complex in the WT (left panel) and miR-204−/− mice (right panel). Upper left panel, image of WT RPE (6 weeks) with intact Bruch’s membrane. Magnification, 10 000×. Scale bar, 1 μm. Lower left panel shows the individual melanosomes dispersed apically within the RPE (10 months). Note the distribution and shape (rounded and elliptical) of the melanosomes. Scale bar, 1 μm. Upper right panel depicting RPE from miR-204−/− mice (6 weeks) shows disrupted Bruch’s membrane (open arrow head) and disorganization of the basal enfolding’s (filled arrow head). Bottom right panel at 10 months shows disrupted photoreceptors in the SRS (filled arrow) and irregular melanosome distribution in the RPE (open arrow). Magnification, 10 000×. Scale bar, 1 μm.
