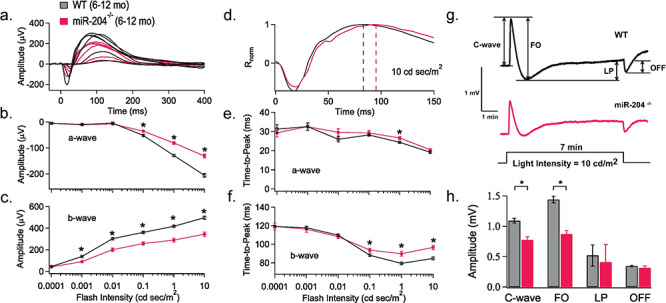
Figure 3.

RPE and retina light responses in miR-204−/− mice. (a) Scotopic ERG responses elicited in response to stimuli of increasing flash intensities are averaged and superimposed to compare WT (black traces; 6–12 months; n = 24 mice) and miR-204−/− (magenta traces; 6–12 months; n = 19 mice) response properties. The corresponding dark-adapted a- and b-wave intensity-response curves for WT and miR-204−/− display reduced photoreceptor and bipolar cell activity (b and c). Significant decreases indicated by asterisks (*P < 0.05, Student’s t-test). (d) The early portion of the ERG response elicited by a bright flash of 10 cd s/m2 is replotted on an expanded time scale of 50 ms per division to highlight differences in response kinetics. Dashed lines indicate an 8 ms delay in the time to peak of the b-wave. (e) Time to peak of the a-wave plotted versus logarithm stimulus flash intensity in cd s/m2. (f) Time to peak of the b-wave plotted versus logarithm stimulus flash intensity in cd s/m2. Significant decreases indicated by asterisks (*P < 0.05, Student’s t-test). (g) DC-ERGs of the RPE electrical response recorded from a WT (n = 11 mice, 6–12 months) and miR-204−/− mouse (n = 5 mice; 6–12 months), in response to a 7 min continuous light stimulus (10 cd/m2), obtained by averaging all measurements from each group of mice. Arrows indicate c-wave, FO, LP and OFF. (h) Amplitudes of the DC-ERG components (c-wave, FO, LP and OFF) for WT (6–12 months, n = 15 mice, n = 26 eyes) and miR-204−/− (6–12 months, n = 13 mice; n = 24 eyes) mice recorded in response to a 7 min light stimulus (10 cd/m2). Data reported as mean; error bars indicate standard error. *P < 0.05.
