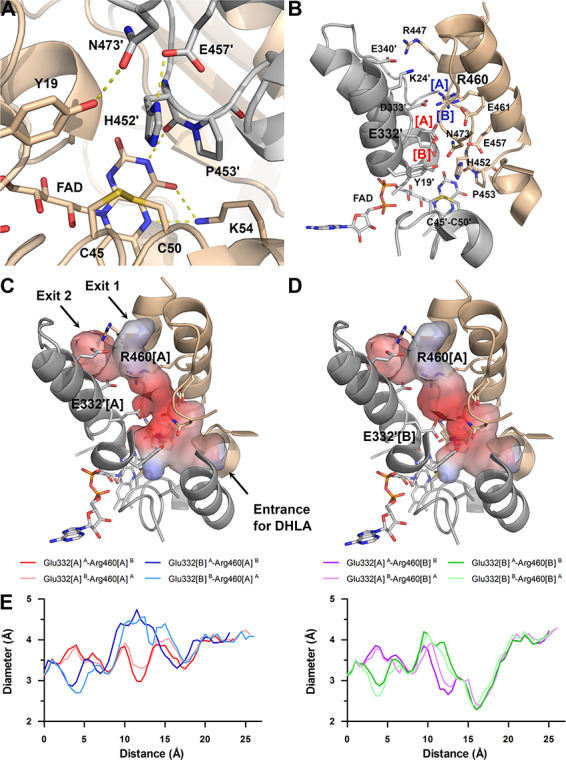
Figure 3.

Active site and its accessibility in the hE3 structure (PDB ID: 6I4Q). (A) Close-up view on the active site: Cys45-Cys50, FAD and His452′ (all depicted as sticks). Chains A and B are colored beige and grey, respectively. H-bonds crucial for catalytic activity are shown as yellow dashed lines. (B) Secondary structural elements that encompass the LA-binding and H+/H2O channels as well as polar/protonatable side chains along the H+/H2O channel are displayed together with the active site in chain B. Alternative conformers are designated with square brackets. Glu332[A] was dominant in both chains, whereas Arg460[A] and [B] were dominant in chains A and B, respectively. (C) Channel surface potentials for Arg460[A]-Glu332′[A]. (D) Channel surface potentials for Arg460[A]-Glu332′[B]. For (C) and (D), surface potentials are displayed on an arbitrary scale (red: negative, blue: positive). The Pro16-Gly29 helix is partially omitted for clarity and thus Lys24 (contributing to surface polarity) is also omitted. Orientations in panels C and D are slightly different relative to panel B. (E) H+/H2O channel diameter along the channel axis as a function of distance from the active site is plotted with respect to the Glu332 and Arg460 alternative conformers. All combinations with Arg460[A] and [B] are in the left and right plots, respectively; A and B in superscript designate the chains.
