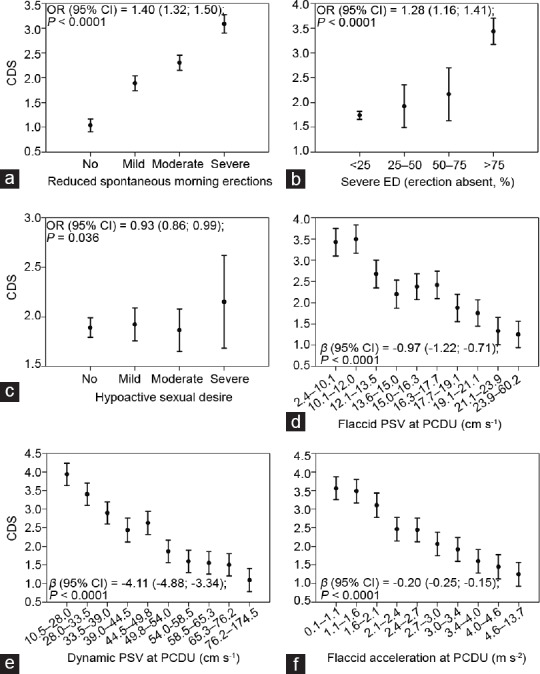
Figure 2.

CDS according to sexual symptoms and penile blood flow. Levels of CDS according to the severity of (a) reduction of spontaneous erections, (b) ED, and (c) hypoactive sexual desire and according to the levels of (d) flaccid PSV, (e) dynamic PSV, and (f) flaccid acceleration. For a graphical purpose, the data are represented as mean and 95% confidence interval of the dependent variable, according to deciles of the independent variable. Statistics reported in each panel are derived from age-adjusted (a–c) ordinal regressions or (d–f) linear regressions. CDS: chronic disease score; ED: erectile dysfunction; PSV: peak systolic velocity; PCDU: penile color Doppler ultrasound; OR: odds ratio.
