
Fig. 1.
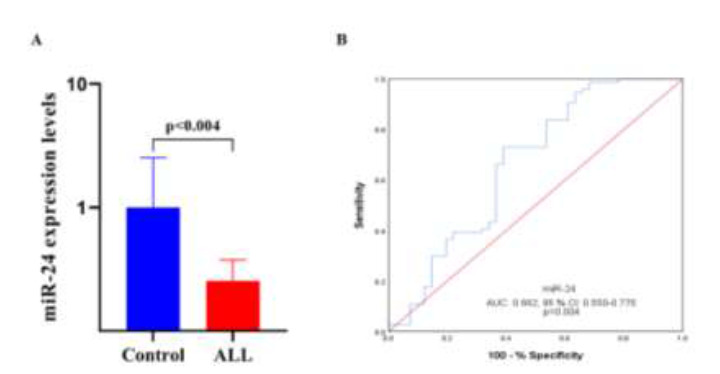
miR-24 expression in healthy controls (n = 41) and pediatric ALL patients (n = 74). Peripheral blood was obtained from all study subjects and total RNA was extracted from plasma. The RNA was polyadenylated and reverse transcribed, and miR-24 expression was determined by quantitative polymerase chain reaction (qPCR). (A) miR-24 expression healthy controls and pediatric ALL patients. (B) ROC curve analysis of miR-24 expression to discriminate between pediatric ALL patients and healthy controls. AUC: area under the curve, CI: confidence interval.