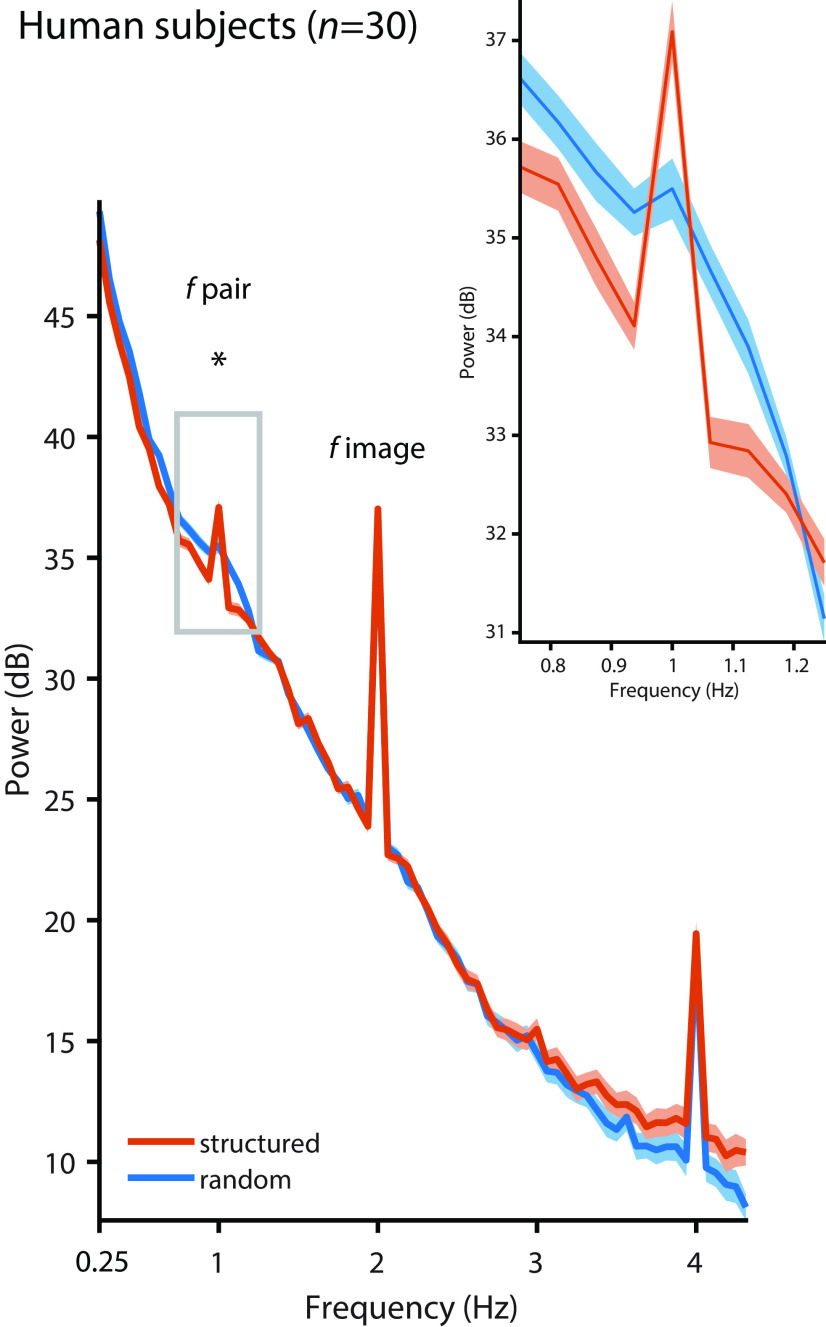
Figure 2.
Pupil diameter in humans. Pupil diameter in human subjects (n = 30) followed the image rate at 2 Hz in the random condition (blue, t(29) = 13.494, p < 0.001, g = 2.140) and the structured condition (orange, t(29) = 15.018, p < 0.001, g = 2.314; compared with the mean of the four surrounding frequencies), but the pair rate at 1 Hz was only evident in the structured condition (structured vs random: t(29) = 3.451, p = 0.002, g = 0.449). The inset shows a zoomed version of the power spectrum at ∼1 Hz. Peaks at 4 Hz likely reflect harmonics. Shading represents the SEM across subjects, corrected for intersubject variability (Morey, 2008). Asterisk indicates statistical significance at p < 0.05 for the contrast structured vs. random condition.

