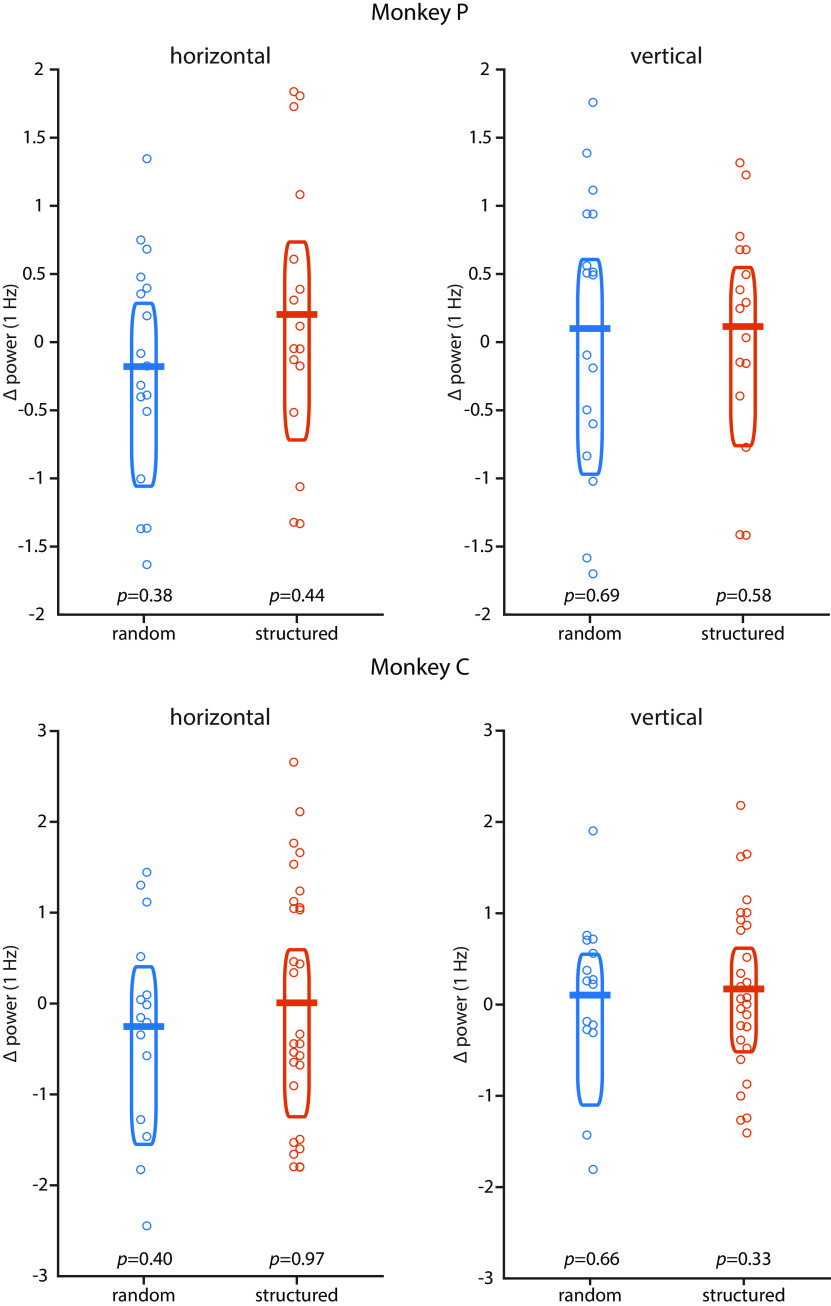
Figure 5.
Eye motion in monkeys. There were no statistically significant peaks at 1 Hz in the dynamics of horizontal or vertical eye position in the random or structured condition in monkey P and monkey C relative to the four surrounding frequency bins. Horizontal bars indicate the mean; boxes indicate the 95% Bayes-bootstrapped high-density interval; circles indicate the data points of individual runs; p values are from paired, two-sided t tests of 1 Hz power against the average of four surrounding frequency bins (all p > 0.3).

