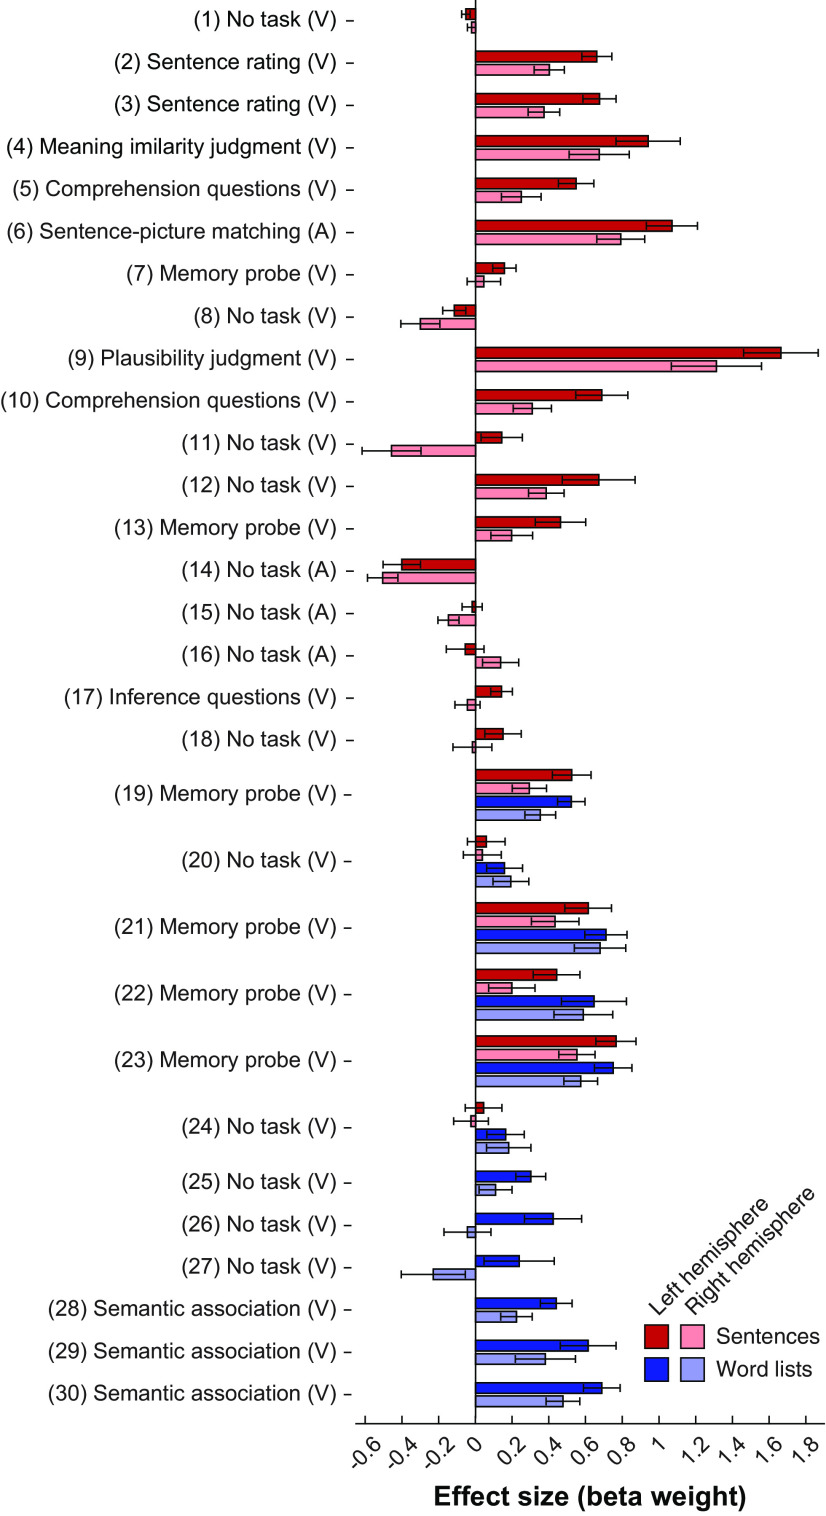
Figure 3.
Responses to sentences and word lists in the MD network across experiments, and their laterality. Responses (β weights for the corresponding regressors in the GLM) are shown averaged across fROIs in the left (darker colors) and right (brighter colors) hemispheres, separately for sentence (red shades) and word list (blue shades) conditions. Responses are measured as β weights for the corresponding condition regressors in the GLM. Bars represent the average response across subjects. Errors bars indicate SEM across subjects. Most experiments include either sentences or word lists, except for Experiments 19–24.

