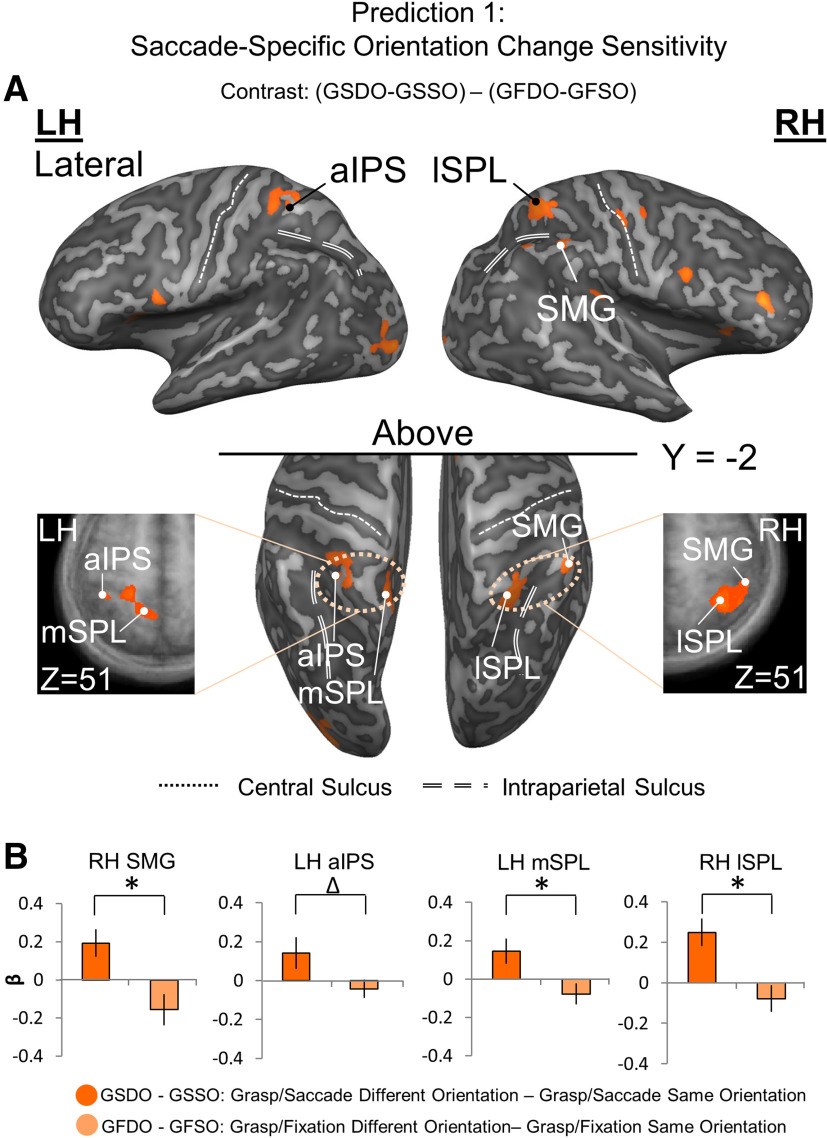
Figure 3.
Localizing (A) and testing (B) sites for Prediction 1: saccade-specific orientation change sensitivity. A, Voxelwise statistical map overlaid onto inflated brain rendering of an example participant obtained using an RFX GLM (n = 13) for Different > Same in the Grasp Saccade (GS) condition compared with the Grasp Fixate (GF) condition, derived from the Action Execution phase. Top panels, Lateral views of the inflated brain rendering on which can be seen activation in right lSPL and SMG. Black/white dots represent peak voxels of activation. Middle, Bottom panels, Top view of the left and right hemispheres, which display activation also in the left aIPS and mSPL. Left and rightmost panels, Transverse slices through the average brain of all the participants onto which the activation in these four regions can be viewed in more detail. These results (that the final motor plan was modulated by the initial stimulus orientation) contradict the notion that participants waited for the second stimulus orientation to begin action planning. Instead, they show that an orientation-specific action plan was formed immediately, and then updated when the second stimulus was presented. B, Bar graphs of β weights plotted for the difference between the Grasp Saccade Different and Same Orientation conditions (dark orange) versus the difference between the Grasp Fixation Different and Same conditions (light orange). The small, variable Grasp Fixation results are analogous to the results of sensory adaptation studies, where both repetition suppression and enhancement effects have been observed. Data were extracted from the active voxels in the transsaccadic sites shown in A. To quantitatively test Prediction 1, we performed a priori-motivated repeated-measures t tests; given that there are four areas and therefore, four t tests to be conducted, the significance level p value (0.05) was Bonferroni-corrected (0.05/4 = 0.0125). Statistical tests were conducted on β weights extracted from active voxels of these sites to test Prediction 1. Values are mean ± SEM analyzed by repeated-measures t tests (for specific statistical values, see Results). *Statistically significant difference between the GS and GF β weights (i.e., that the p value obtained is less than the Bonferroni-corrected p = 0.0125). Δ indicates an uncorrected significant difference between the GS and GF β weights (i.e., that the p value obtained is less than the original significance level p = 0.05, but is not less than the Bonferroni-corrected p = 0.0125).

