Figure 4.
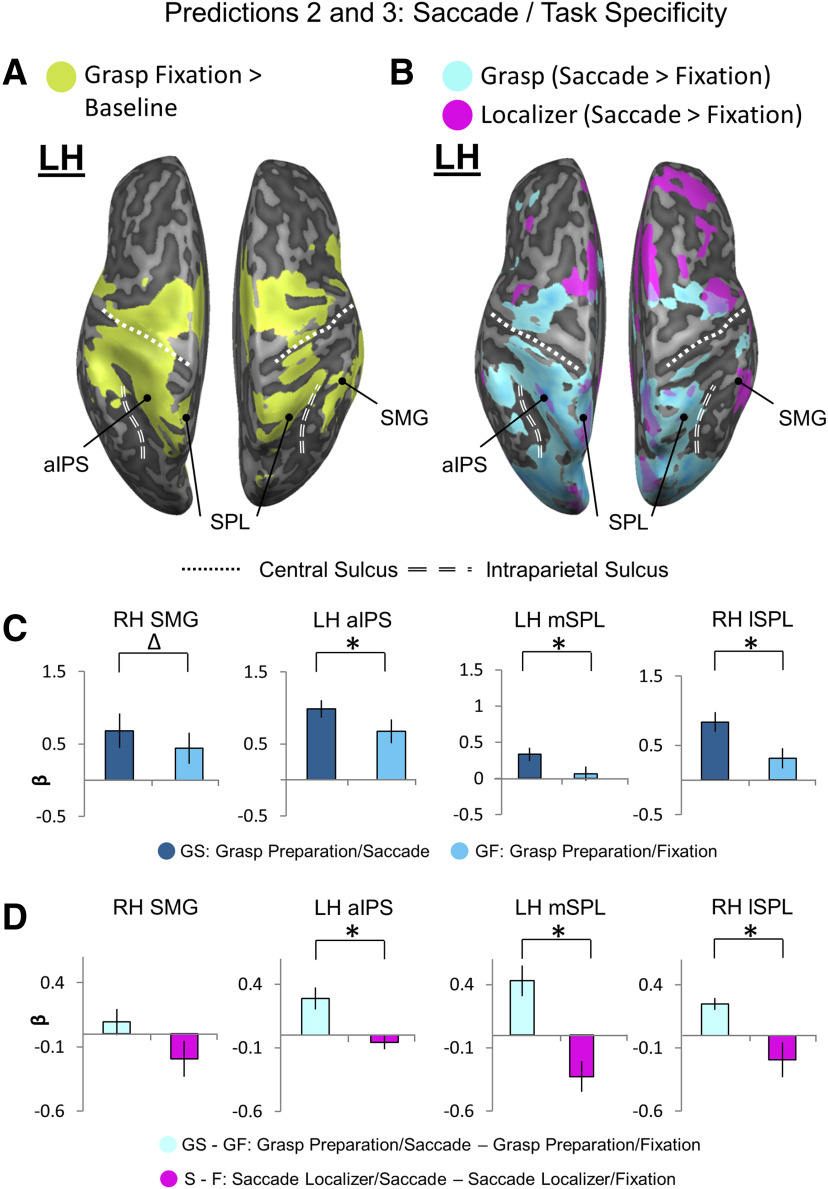
Location of putative transsaccadic updating sites (from Figure 3) superimposed on general grasp regions (A) and saccade modulations (B) derived from the Action Preparation phase, followed by tests for Predictions 2 (C) and 3 (D). A, An inflated brain rendering of an example participant (left and right hemispheres viewed from above, respectively). An activation map obtained using an RFX GLM (n = 13) is shown for the contrast, Grasp Fixation > Baseline (chartreuse). The four putative transsaccadic grasp updating sites (depicted as black dots) from Figure 3 are superimposed on this activation. B, Activation maps for a Saccade > Fixate contrast obtained using an RFX GLM (n = 13) on grasp experiment data (sky blue) and on a separate saccade localizer (fuchsia) were overlaid onto an inflated brain rendering from an example participant (left and right hemispheres shown from a bird's eye view). These overlaid activation maps allow for comparison of which cortical sites respond to saccade signals in a grasp task-specific manner. C, Bar graphs of β weights plotted for Grasp Saccade (GS) conditions (dark blue) versus Grasp Fixation (GF) conditions (light blue) from all 13 participants. Data were extracted from active voxels from the transsaccadic sites, the peak voxels of which are represented by the black dots above in A and B to test Prediction 2. To quantitatively test Prediction 2, we performed a priori-motivated repeated-measures t tests; given that there are four areas and, therefore, four t tests to be conducted, the significance level p value (0.05) was Bonferroni-corrected (0.05/4 = 0.0125) (for specific statistical values, see Results). Values are mean ± SEM analyzed by repeated-measures t tests. D, Bar graphs of β weights plotted for Grasp Saccade conditions (pale blue) versus Grasp Fixation conditions (magenta). Data were extracted from the transsaccadic sites shown in Figure 2A, B, which were compared for only the 10 participants whose data were analyzed for the saccade localizer. Statistical tests were conducted on β weights extracted from the active voxels of these areas to test Prediction 3. Values are mean ± SEM analyzed by dependent t test. To quantitatively test Prediction 3, we performed a priori-motivated repeated-measures t tests; given that there are four areas and, therefore, four t tests to be conducted, the significance level p value (0.05) was Bonferroni-corrected (0.05/4 = 0.0125) (for specific statistical values, see Results). *Statistically significant difference between the GS and GF β weights (i.e., that the p value obtained is less than the Bonferroni-corrected p = 0.0125). Δ indicates an uncorrected significant difference between the GS and GF β weights (i.e., that the p value obtained is less than the original significance level p = 0.05, but is not less than the Bonferroni-corrected p = 0.0125).

