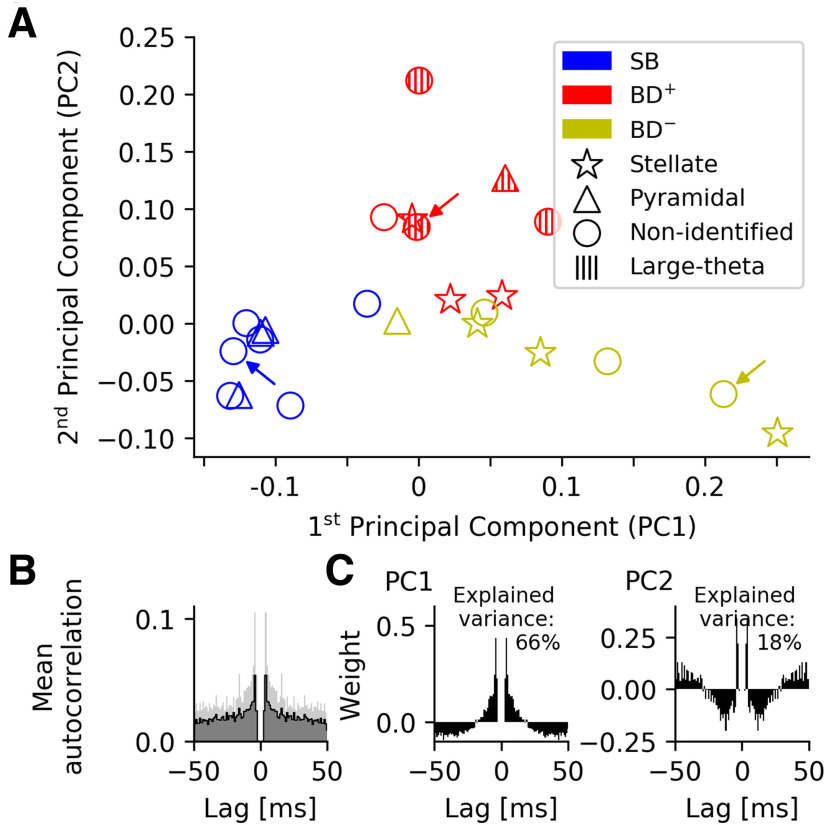
Figure 3.
Spike-time autocorrelations of MEC grid cells from mice moving in virtual corridors. A, visual inspection of spike-time autocorrelations suggests a separation in two major groups, SB and bursting. Based on the intracellular measurements (see Fig. 1), the group of bursting neurons can be subdivided in cells with DAP (BD+), which are shown in red, and cells without detectable DAP (BD–), shown in yellow. The arrows mark the example neurons shown in Figure 1. One cell has intermediate properties and is assigned to the sparsely-bursting group (blue) by k-means clustering (k = 2). B, Mean autocorrelation. Shaded areas show the variability in the data (SD). C, The first two principal components of the spike-time autocorrelations. The pronounced peaks in B, C demonstrate that ISIs of around 4 ms are indicative of both the mean grid-cell discharge patterns and their cell-to-cell variability.

