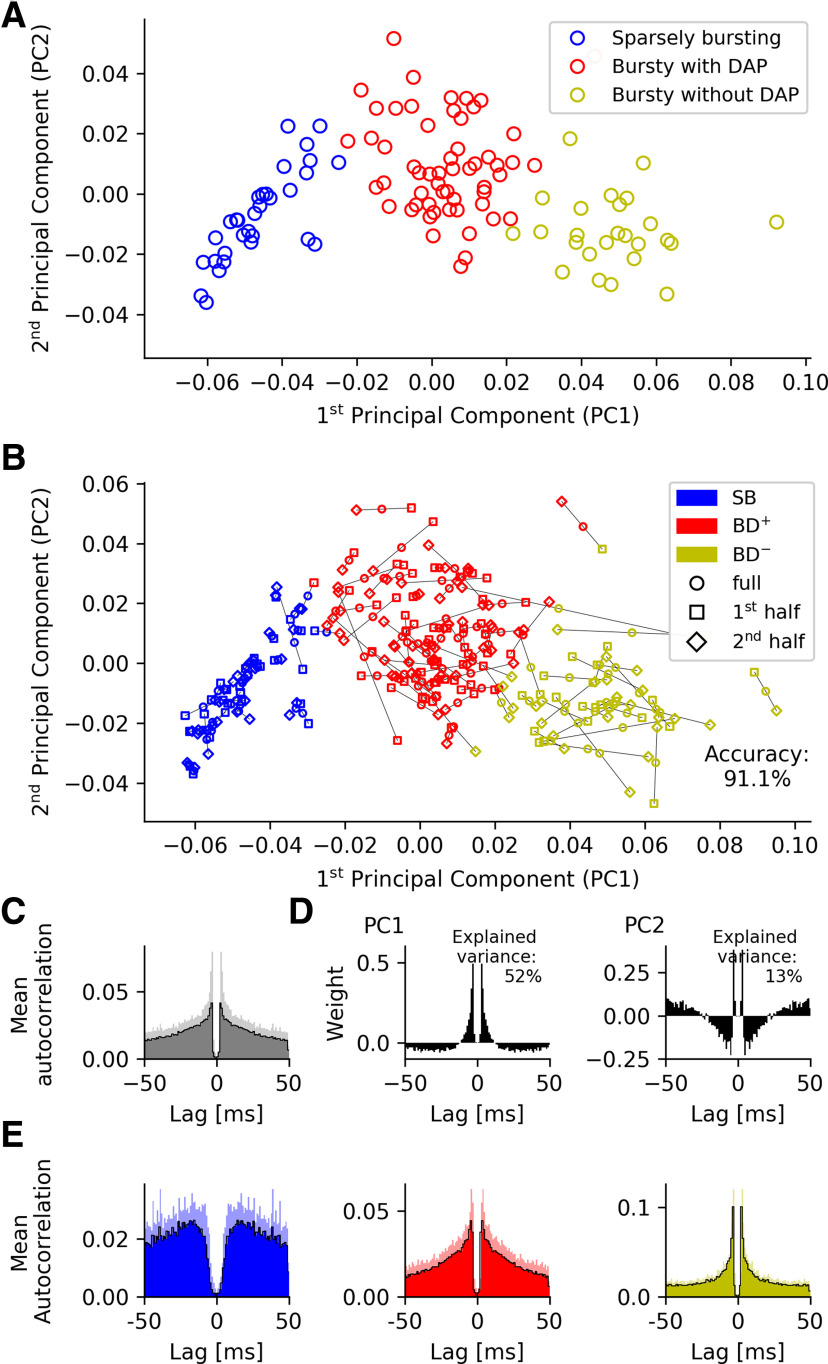
Figure 5.
Spike-time autocorrelations of MEC grid cells from mice moving in open arenas. A, k-means cluster analysis (k = 3) of spike-time autocorrelations. B, To test the robustness of the PCA-based class assignment in A, we separately considered the first and second half of all spikes for each neuron. We then computed the autocorrelations within these two sets and projected the results into the PC space of the full data. k-means clustering (k = 3) results in only 8.9% of neurons switching group identity, underscoring the robustness of the cluster analysis. C, Mean autocorrelation across the grid cells. Shaded areas, SD. D, The first two principal components of the spike-time autocorrelations. The sharp peaks in B, C again demonstrate the prevalence of short ISIs (here around 3.5 ms) in the mean grid-cell discharge patterns as well as their cell-to-cell variability. Shaded areas, SD. E, Autocorrelations averaged across all neurons from each cell group reveal a striking similarity between cells recorded on virtual tracks and in open fields. Strongest deviations are shown by non-bursting/SB cells in the Latuske et al. (2015) versus Domnisoru et al. (2013) data.

