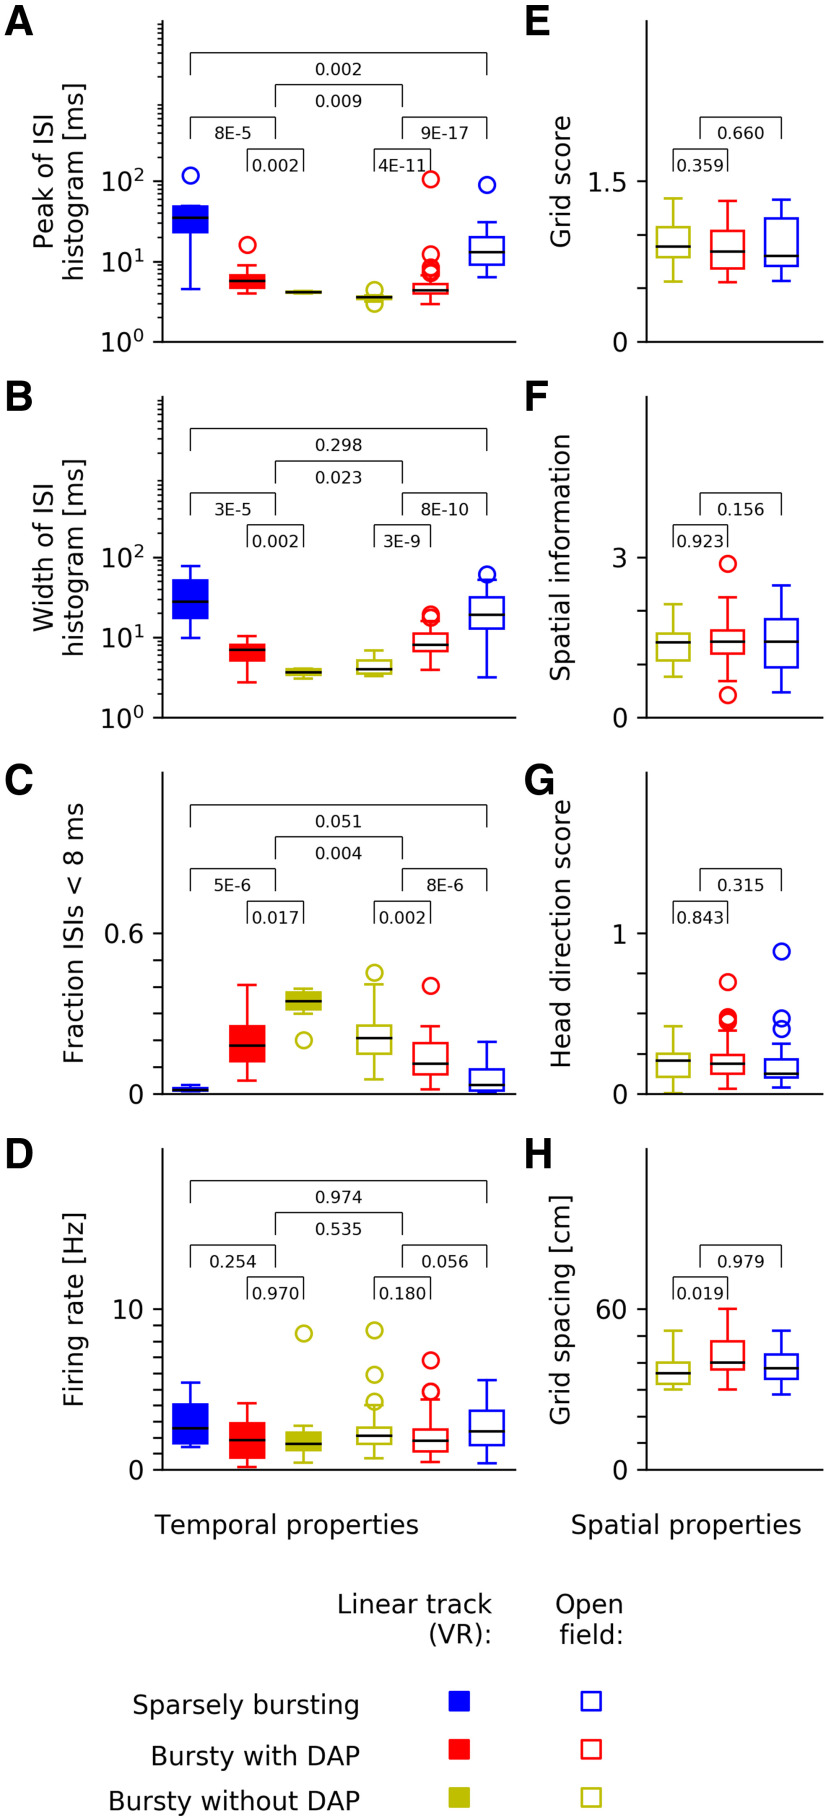
Figure 6.
Grid-cell spike-train characteristics across datasets and spatial coding. A–D, Comparison of linear-track data (filled symbols) and data from the open arena (un-filled symbols). E–G, Spatial properties of grid fields recorded in the open arena. A, ISI peak, i.e., most likely ISI. B, Width of the ISI distribution. C, Fraction of ISIs below 8 ms (“burstiness”). D, Mean firing rates. E, Grid score. F, Spatial information. G, Head direction score. H, Grid spacing. Despite strong differences in temporal spike-train characteristics (A–C), mean firing rates (D) and spatial coding properties (E–H) of grid cells are largely conserved across all three cell groups, with a slight difference in grid spacing between BD+ and BD– cells. The p values are calculated from Kolmogorov–Smirnov tests.

