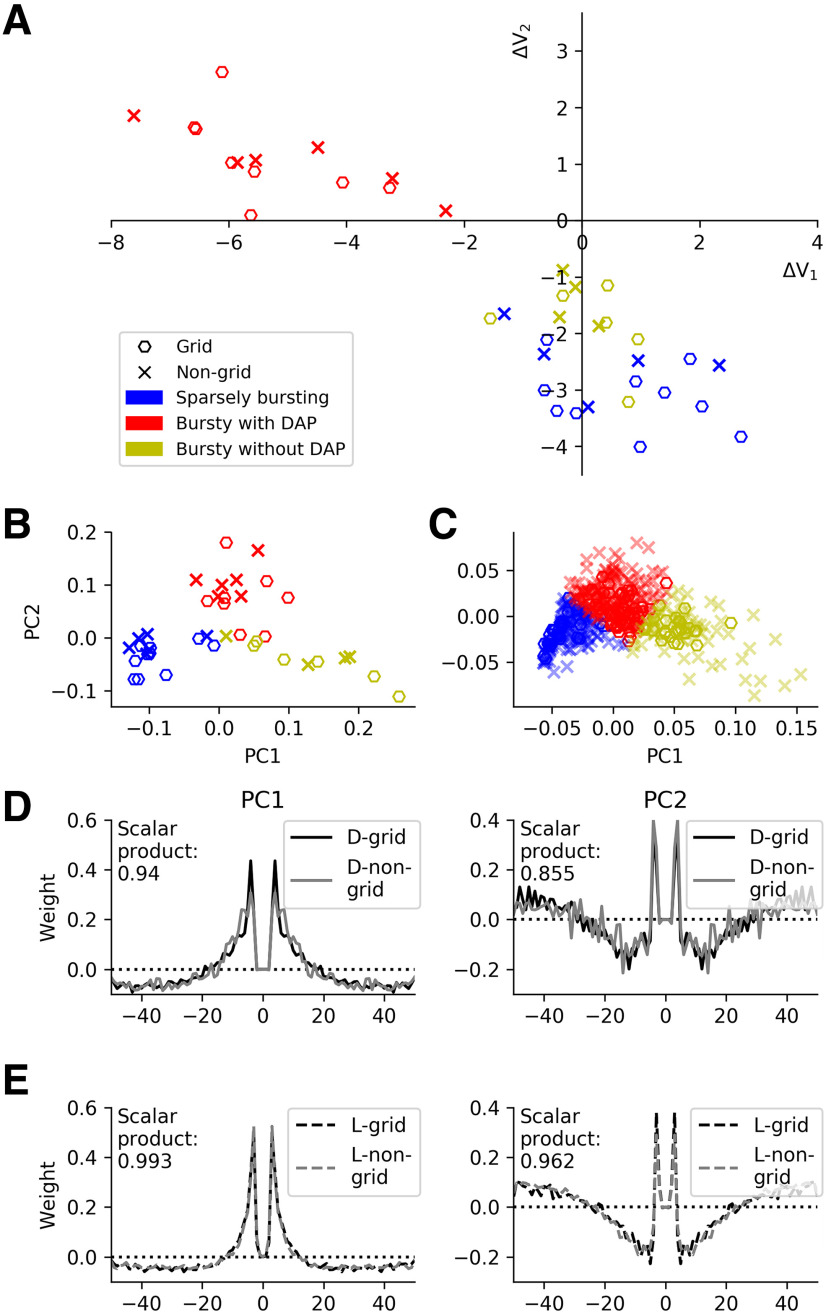
Figure 8.
Comparison of the characteristics of grid cells and non-grid cells. A, Quantification of spike afterpotentials as in Figure 1D but now for all principal cells recorded on the virtual linear track. B, PCA of spike-time autocorrelations as in Figure 3A but now for all principal cells recorded on the virtual linear track. C, PCA of spike-time autocorrelations as in Figure 5A but now for all principal cells recorded in the open environment. The high similarity between grid cells and non-grid cells suggests that the three functional cell classes identified in this study are universal across all principal cells in the superficial MEC layers. D,, First and second principal components (left and right panels, respectively) of the virtual-track dataset for grid cells and non-grid cells. The similarity of the PC components is measured by the scalar product for time lags up to 50 ms. E, As in D, but now for the data recorded in the open environment. The values of the scalar products are rather close to their maximal value of 1 and underscore the similarity of the grid-cell and non-grid-cell autocorrelations and their cluster structure.

