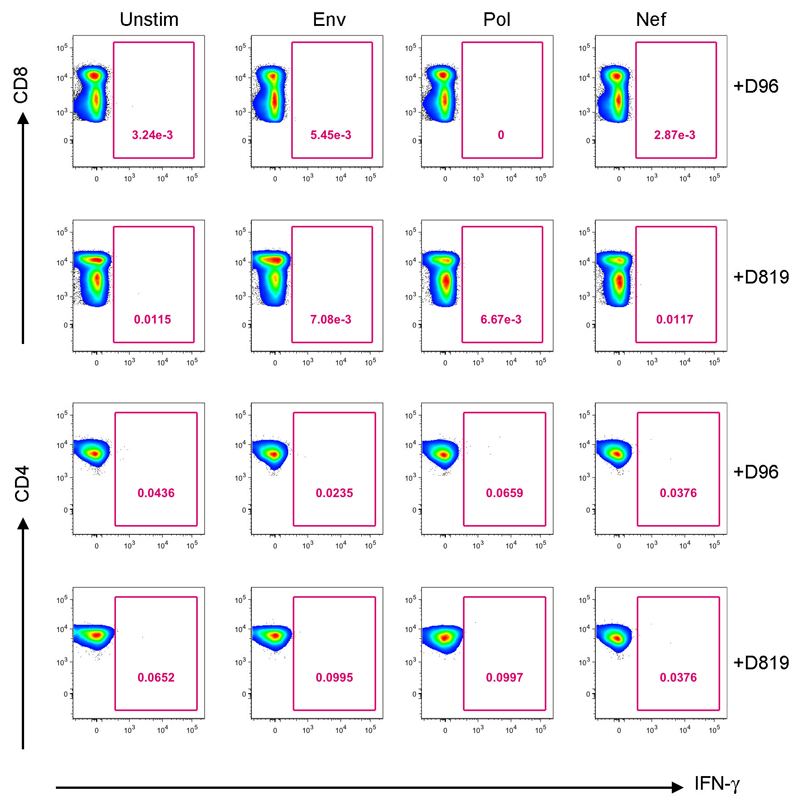
Extended data figure 3. CD8+T cell responses and CD4 T cell responses to HIV.
Representative FACS plots showing percentage of virus specific CD8+ T cells (top panel) and CD4+ T cells (bottom panel) identified via intracellular staining for IFN-g, following stimulation with HIV Pol, Env and Nef peptide pools post-HSCT at days +D96 and +D819.

