
Figure 4:
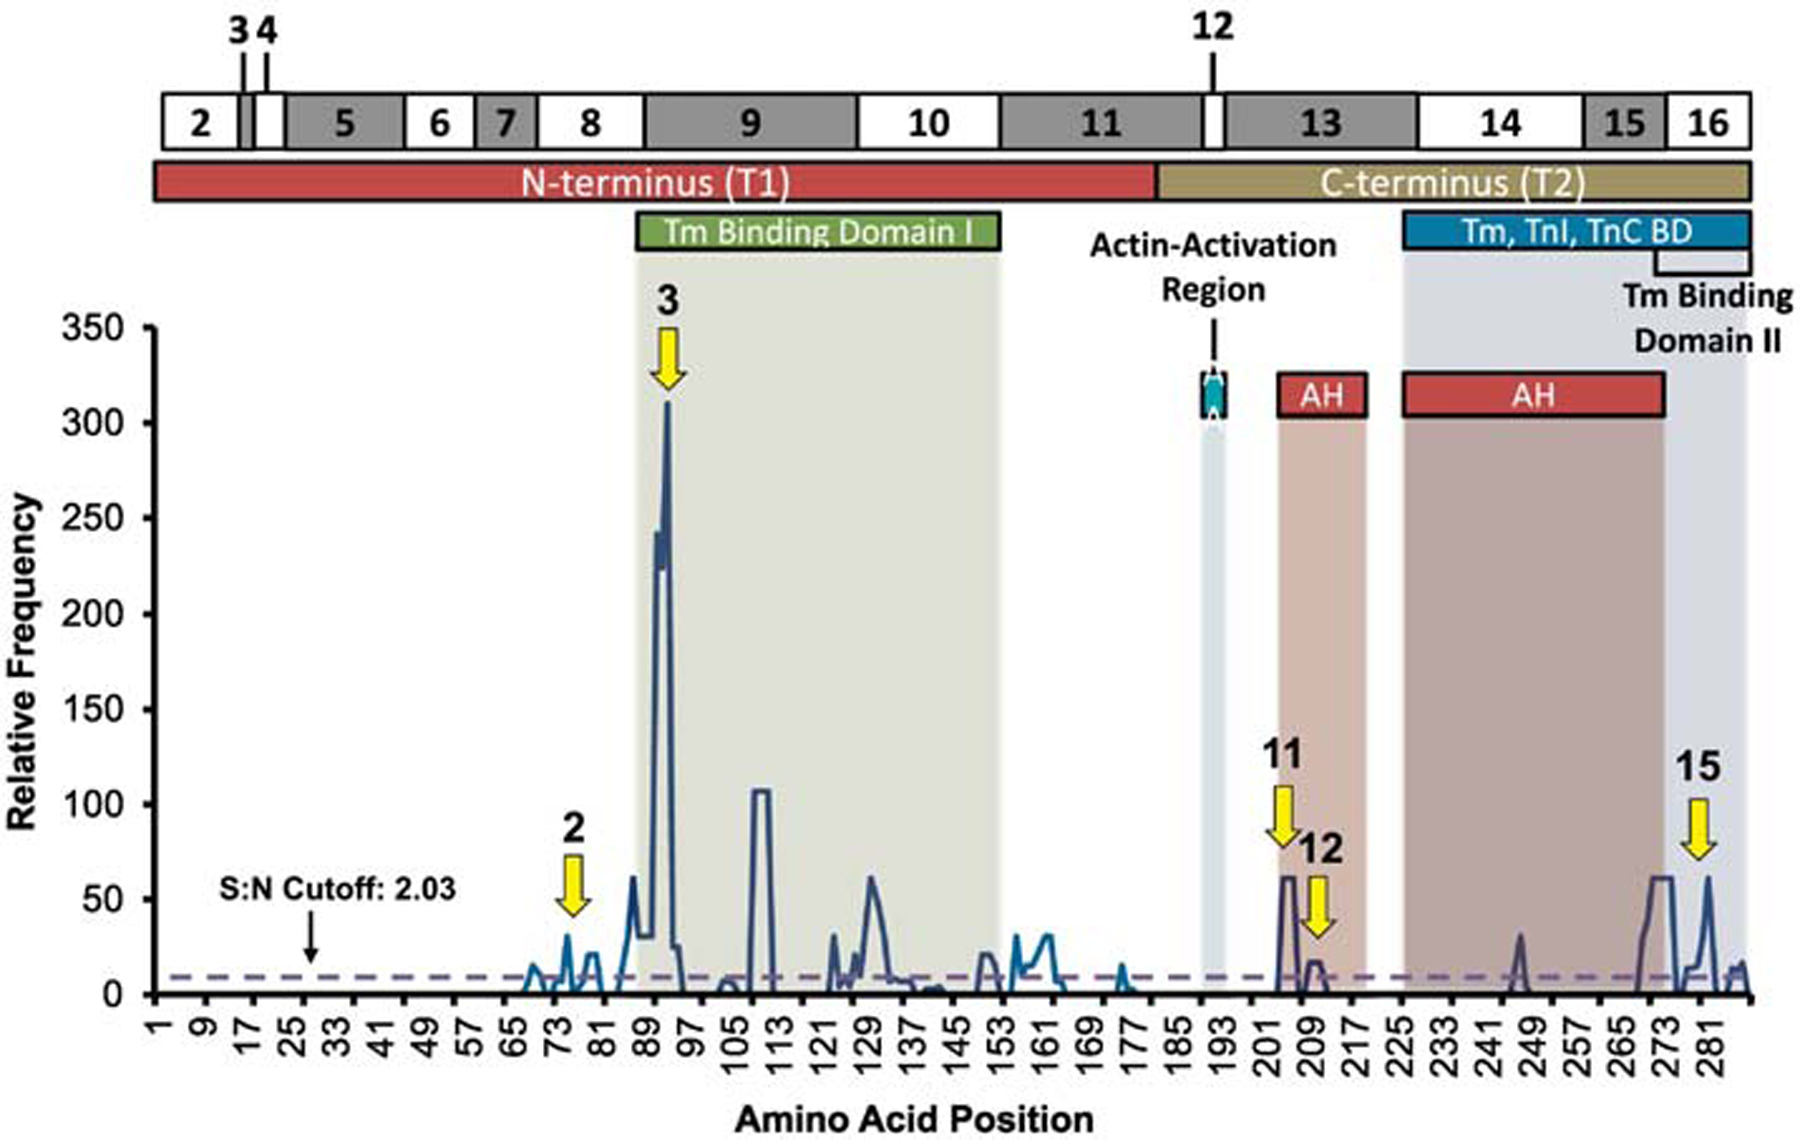
Signal-to-noise ratio analysis of TNNT2 probands mapped against TnT amino acid location and domain: N-Terminus, tropomyosin (Tm) binding domains, actin-activation region, the Tm, TnI, and TnC binding domain, and alpha helix (AH) 1 and 2. Arrows point to significant hotspots with outcome relevance.