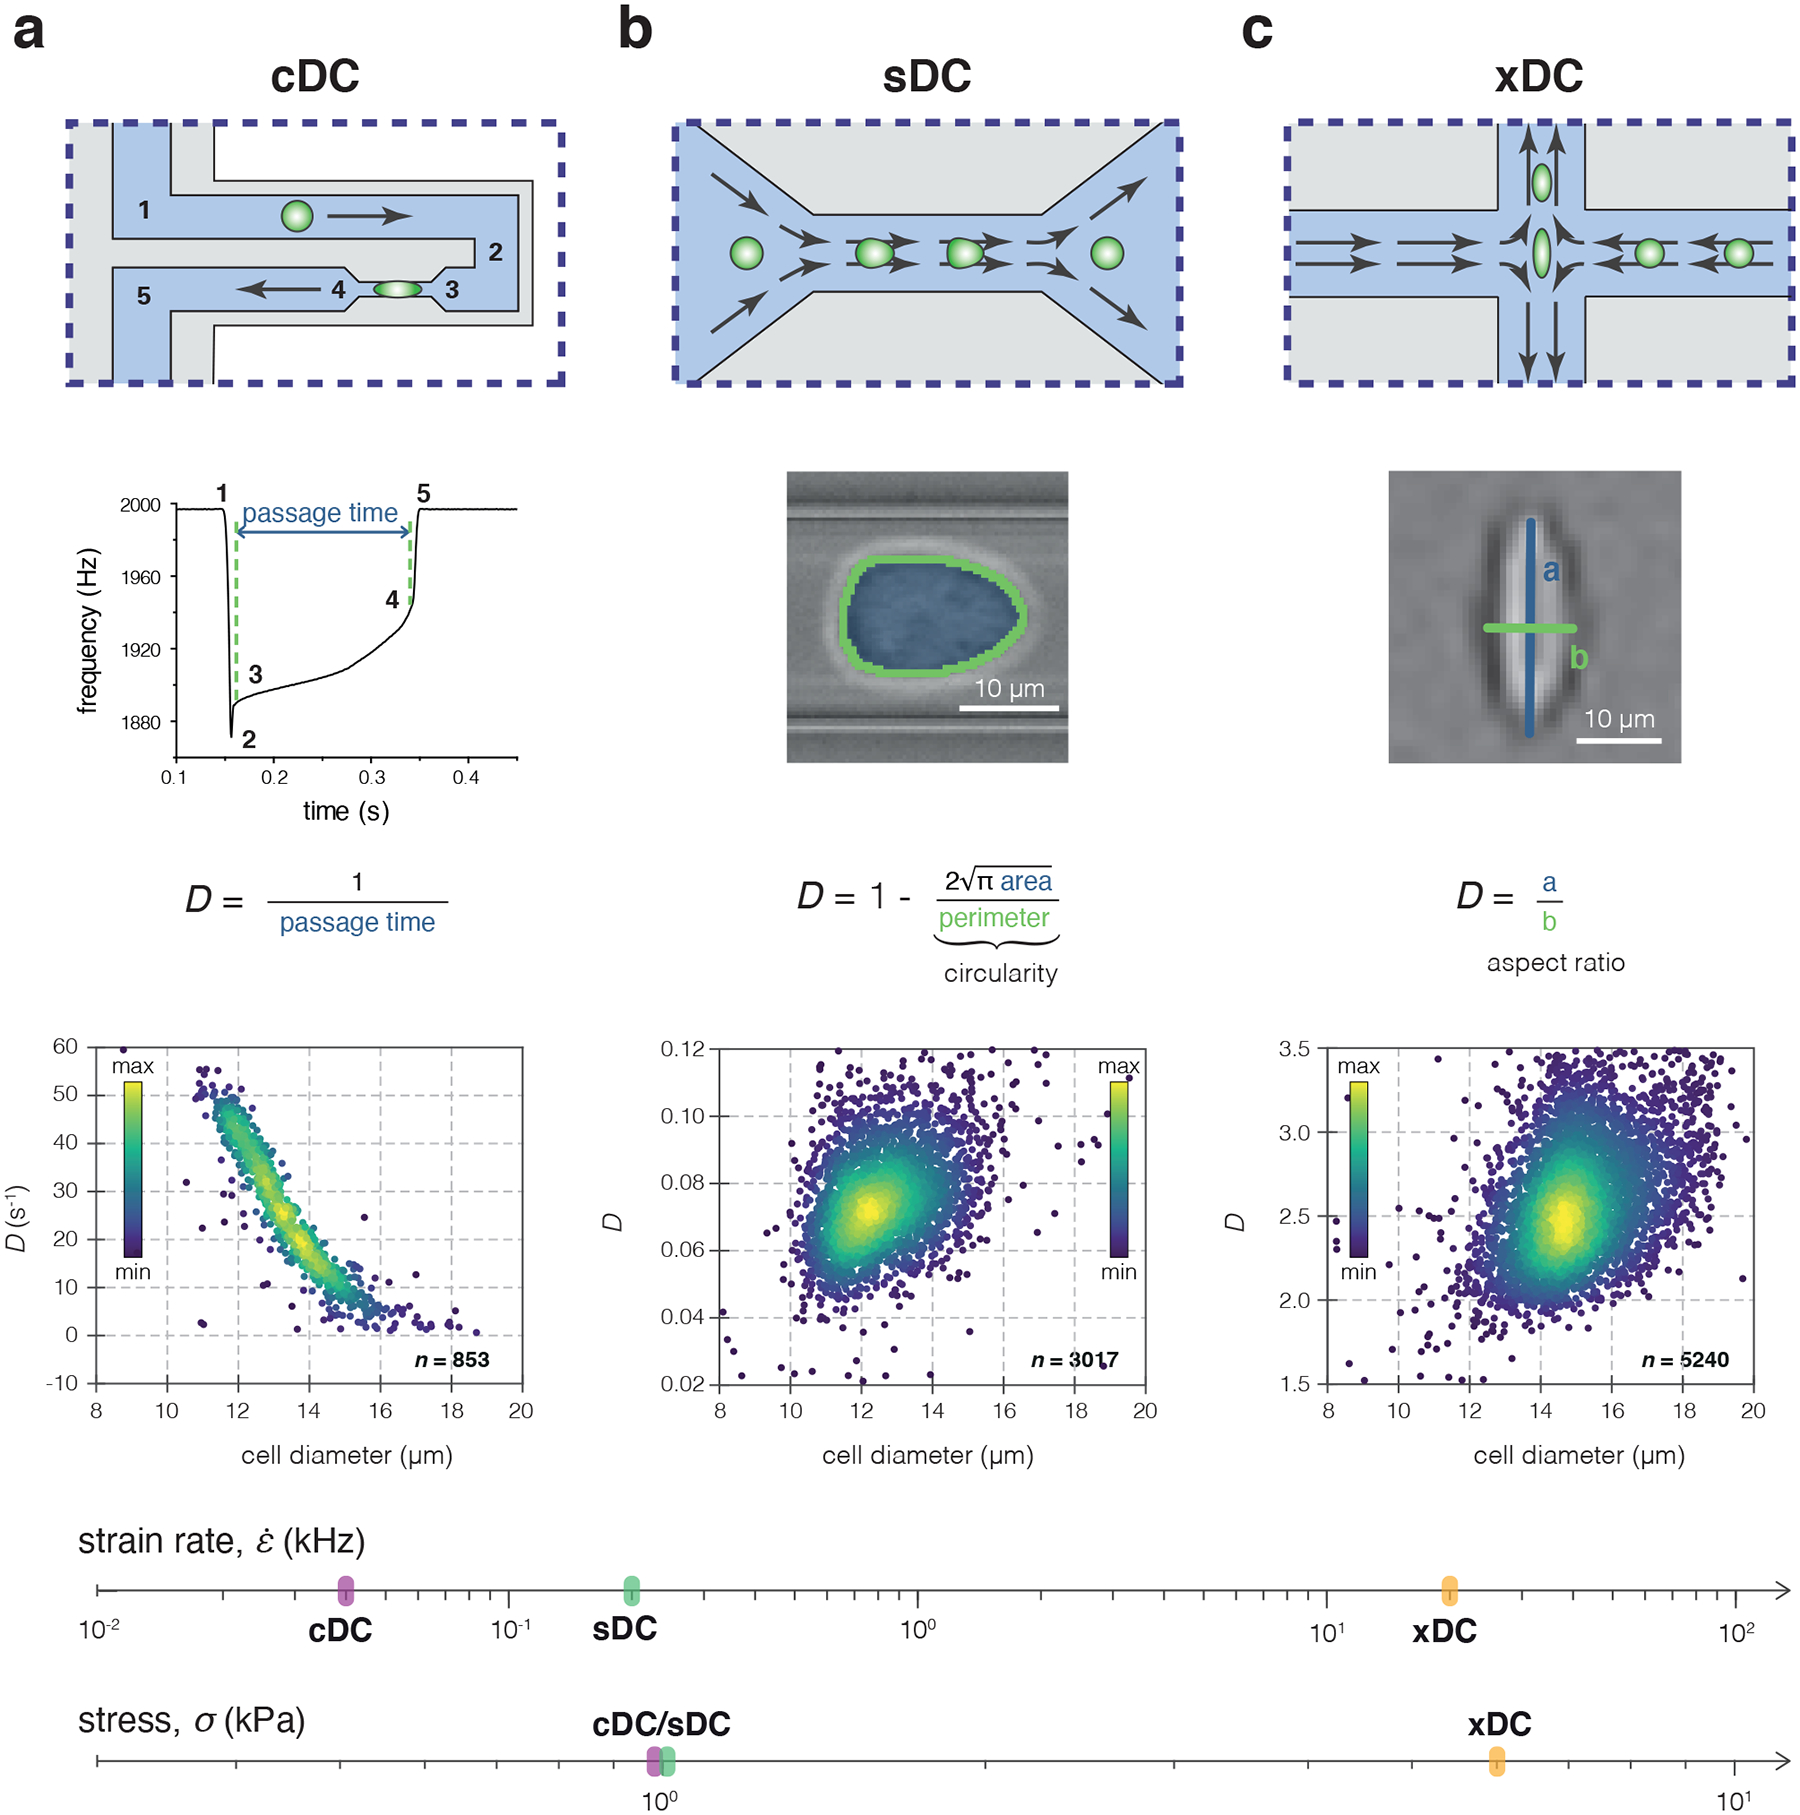
Figure 1|. Comparison of the microfluidic-based approaches for the determination of cell deformability used in this study.

(a-c) Operation principle of cDC (a), sDC (b) and xDC (c). The upper row of each panel illustrates a schematic representation of the chip geometry used in the respective method. The middle row provides an overview of how the deformability, D, is defined for each method. The numbers 1–5 in the plot of frequency vs time correspond to the cell positions in the cDC microchannel indicated in the scheme above. In the lower row, typical scatter plots of D versus cell diameter from the respective measurements are presented. The color map corresponds to event density. The strain rate and stress applied to the cells in cDC, sDC and xDC are indicated on the corresponding axes at the bottom of the panel.
