Figure 2.

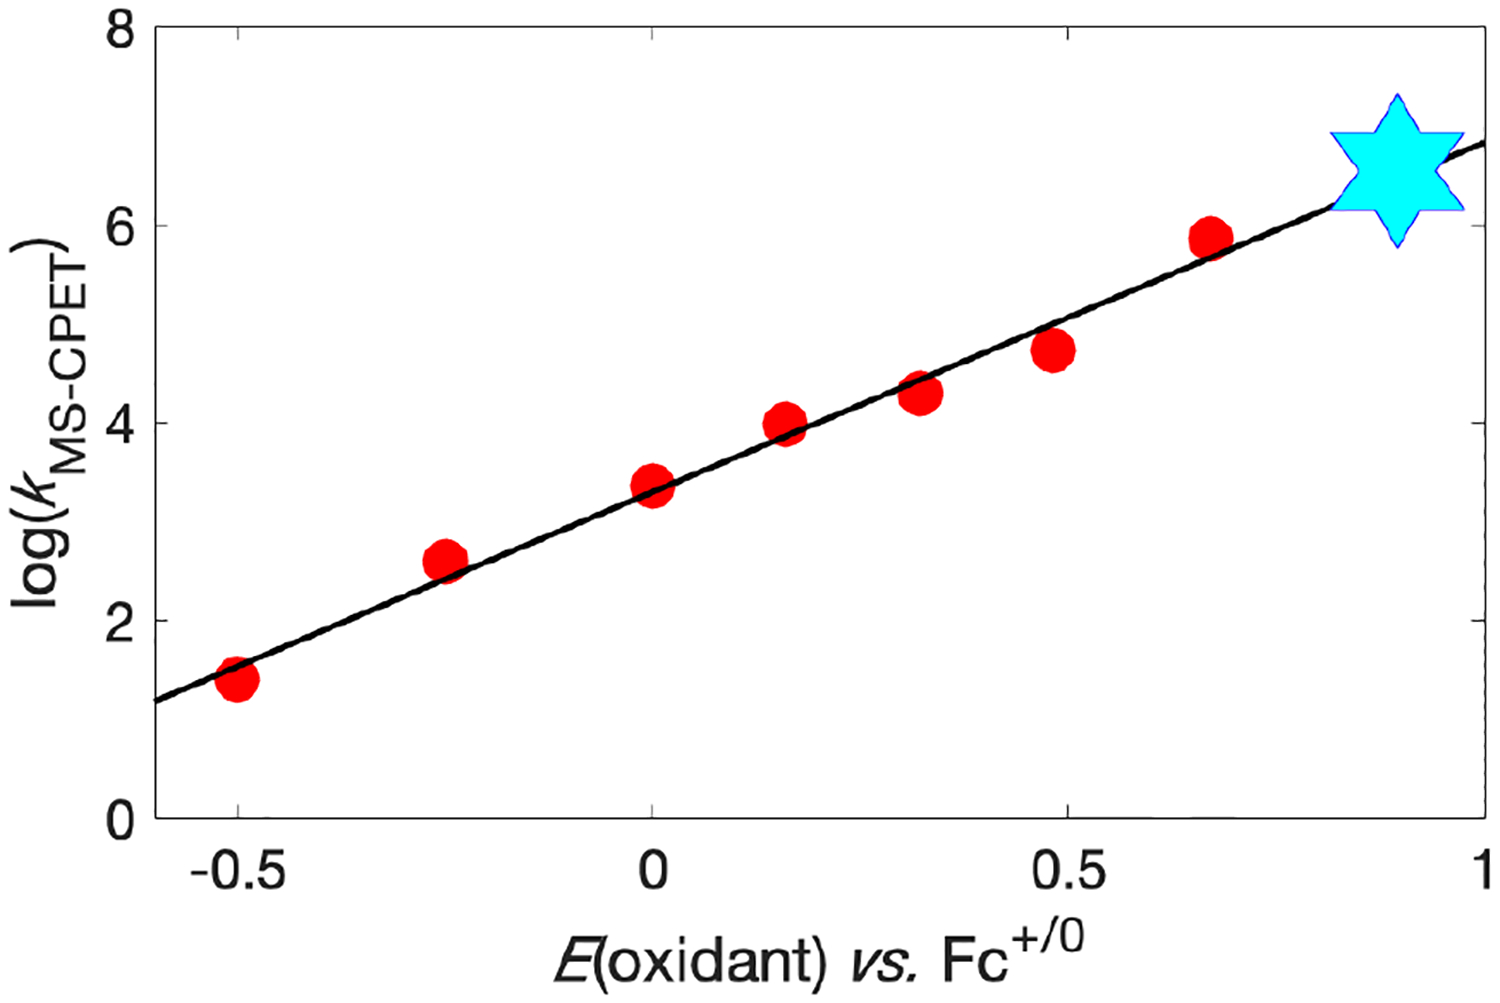
Plot of rate constant vs. oxidant strength for oxidation of 1. Red circles and trendline are thermal oxidations;5a cyan star is oxidation by *[IrIIItBu] (this work). Star size encompasses uncertainty in KMS–CPET and E(oxidant).

Plot of rate constant vs. oxidant strength for oxidation of 1. Red circles and trendline are thermal oxidations;5a cyan star is oxidation by *[IrIIItBu] (this work). Star size encompasses uncertainty in KMS–CPET and E(oxidant).