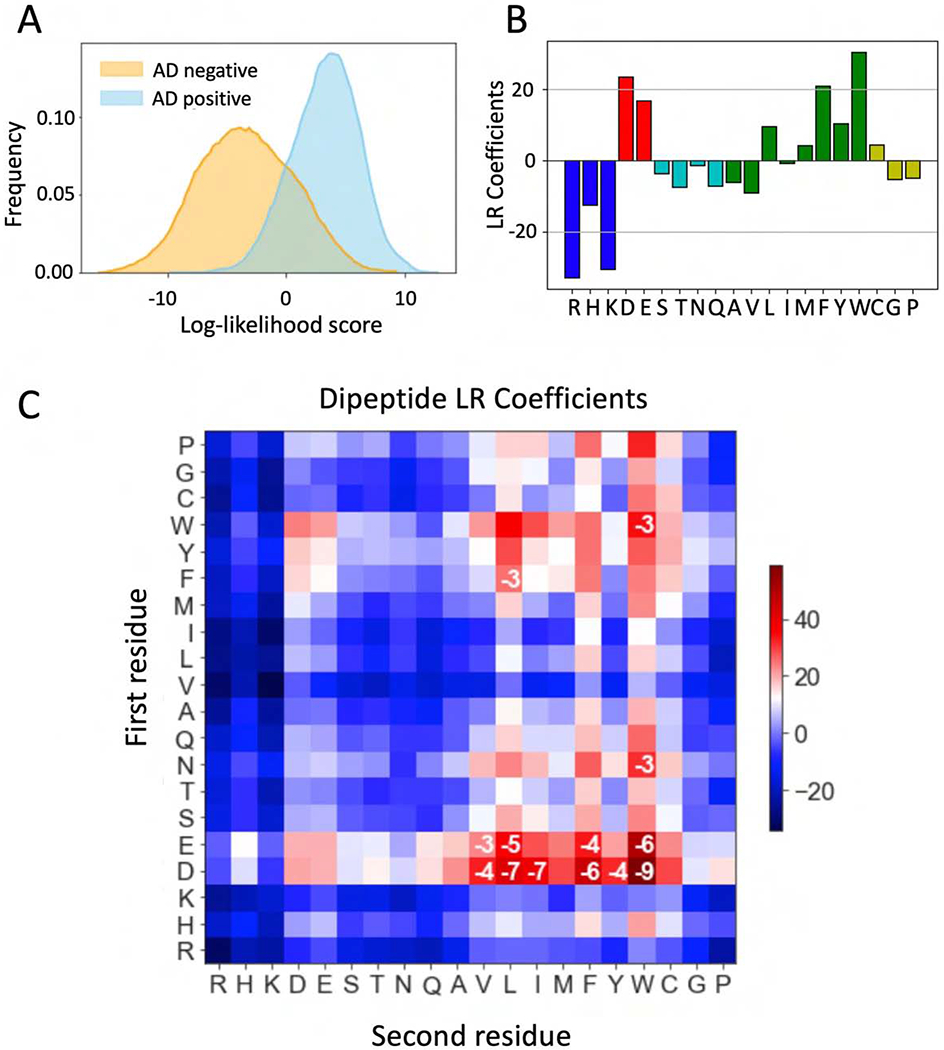
Figure 2.

Properties of synthetic ADs. A) Distribution of log-odds scores for sequences from the AD-positive (blue) and AD-negative (orange) sets. B) Coefficients of amino acid frequencies derived from a logistic regression model for AD probability. Blue = positive charge; red = negative charge; green = hydrophobic/aromatic, cyan = polar and yellow = others. C) Dipeptide sequences contribute to AD function. Heatmap of coefficients from a logistic regression model using only dipeptide frequencies. The first amino acid in the dipeptide is on the Y-axis. Log10 p-values are shown where p <0.001. p-values are from likelihood ratio tests using all 400 dipeptide regression coefficients versus all but one. See Fig S1.
